Most small business owners who invest time in SEO ask the same question after a few weeks: “Is any of this actually working?” That is a fair question. SEO is not like running a paid ad where the results are immediate and obvious. The feedback loop is longer, the signals are subtler, and if you are looking at the wrong metrics, you can easily convince yourself things are going well when they are not — or panic unnecessarily when they are fine.
This guide gives you a clear, practical system for tracking your SEO results without drowning in data. You will know exactly which metrics to look at, which tools to use, and how to interpret what you see at every stage of your SEO journey.
If you are still in the early stages of building your SEO strategy, you may want to start with the complete small business SEO guide on GrowWithSakib before diving into tracking.
Why Tracking SEO Results Is Different from Tracking Ads
Paid advertising gives you near-instant feedback. You spend money, you get clicks, you measure conversions. SEO does not work that way. Organic search results build over weeks and months, which means your tracking needs to account for trend direction, not just single-day snapshots.
According to Google Search Central, crawling, indexing, and ranking are separate processes that happen on their own schedule. A page you publish today might not rank for three to six months — and that is completely normal.
This time lag is exactly why you need a consistent tracking system. Without one, you cannot tell whether a traffic dip is a real problem or just normal fluctuation. You cannot see whether your efforts are building momentum or stalling out.
The Tiered SEO Metrics Framework
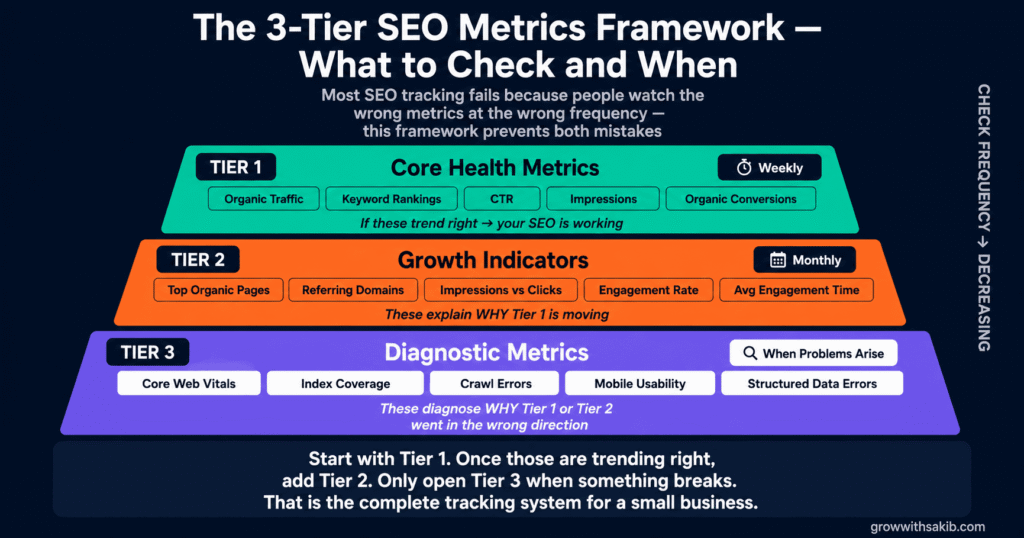
Rather than tracking 20 metrics and feeling overwhelmed, this framework organises your SEO data into three tiers. Tier 1 metrics tell you whether SEO is working at all. Tier 2 metrics tell you why it is or is not working. Tier 3 metrics help diagnose specific technical or structural issues.
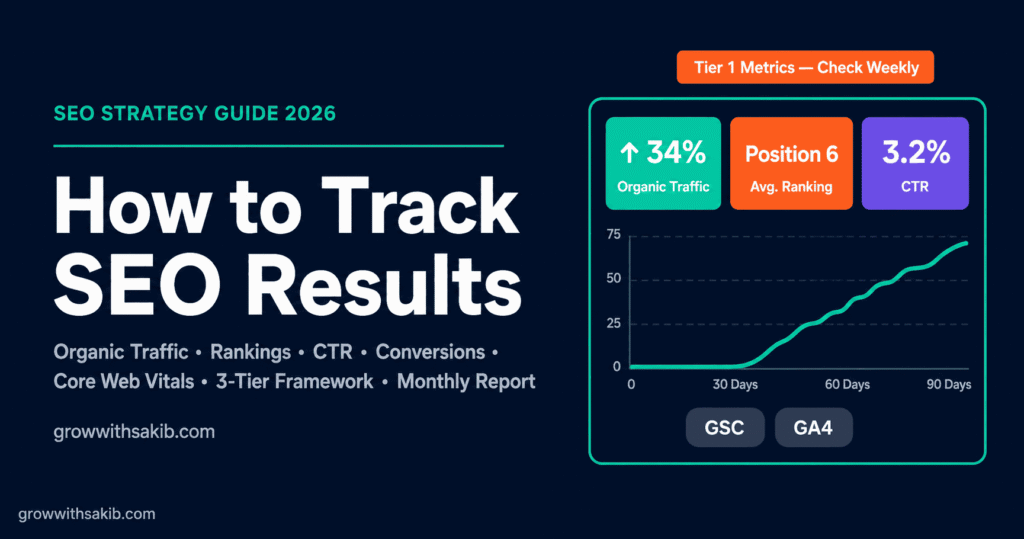
Tier 1: Core Health Metrics (Check Weekly)
These are the five numbers every small business owner must watch. If these are trending in the right direction, your SEO is working.
| Metric | What It Tells You | Where to Find It | Target Direction |
| Organic Traffic | How many people visit your site from search engines | Google Analytics 4 → Reports → Acquisition → Traffic Acquisition | 📈 Up over 90 days |
| Keyword Rankings | Which position your key pages appear in on Google | Google Search Console → Performance → Search Results | 📈 Moving toward top 10 |
| Click-Through Rate (CTR) | What % of people who see your result actually click it | Google Search Console → Performance | 📈 Above 3–5% for branded; 1–2% for non-branded |
| Impressions | How often your pages appear in search results | Google Search Console → Performance | 📈 Growing over time |
| Organic Conversions | Leads, calls, purchases that come from organic search | Google Analytics 4 → Reports → Conversions | 📈 Increasing alongside traffic |
Tier 2: Growth Indicators (Check Monthly)
Once your Tier 1 metrics are moving, these indicators help you understand what is driving growth and where to focus next.
| Tier 2 Metric | What It Reveals | Where to Find It |
| Pages Driving Organic Traffic | Reveals which content is actually working; helps you identify topics to expand | GA4 → Reports → Engagement → Pages and Screens (filtered to organic) |
| Backlinks and Referring Domains | Measures your site’s authority growth; directly influences ranking potential | Google Search Console → Links; Ahrefs or SEMrush for deeper data |
| Top Queries by Impressions vs. Clicks | Identifies pages that rank well but fail to attract clicks — a title/meta description fix opportunity | Google Search Console → Performance → filter by Page, compare Impressions vs. Clicks |
| Bounce Rate / Engagement Rate | In GA4, Engagement Rate (inverse of bounce rate) shows whether visitors find value in your content | GA4 → Reports → Engagement → Overview |
| Average Engagement Time | How long people spend on your pages; signals content quality to Google | GA4 → Reports → Engagement → Pages and Screens |
Tier 3: Diagnostic Metrics (Check When Something Looks Wrong)
These metrics do not tell you much on their own. They help you investigate when Tier 1 or Tier 2 metrics move in the wrong direction.
- Core Web Vitals scores (LCP, INP, CLS)
- Index coverage — which pages Google has indexed vs. excluded
- Crawl errors and redirect chains
- Mobile usability issues
- Structured data errors
- Page-level keyword cannibalisation signals
Setting Up Your Two Essential Free Tools
You do not need an expensive tool to track SEO results effectively. The two platforms that every small business should have connected are Google Search Console and Google Analytics 4. Both are free. Both are built by Google. Together they give you a complete picture of your organic search performance.
Setting Up Google Search Console
Google Search Console (GSC) is your direct window into how Google sees your website. It shows you which queries people use to find you, where you rank, how many impressions you generate, and whether Google can crawl and index your pages properly.
- Step 1: Verify ownership — Log in to Google Search Console and add your property. Choose the URL-prefix method and verify via Google Analytics or HTML tag.
- Step 2: Submit your sitemap — In GSC, go to Sitemaps and submit your XML sitemap URL. This speeds up indexing.
- Step 3: Set up Performance filters — Under Performance → Search Results, set your date range to the last three months. This gives you a baseline.
- Step 4: Connect to Google Analytics — Link GSC to your GA4 property to see search data inside Analytics.
Setting Up Google Analytics 4
If you are migrating from Universal Analytics (UA), be aware that GA4 uses a completely different data model. Google announced the full sunset of UA in July 2023. GA4 is now the only option — and its terminology is different.
| Old Universal Analytics Term | Google Analytics 4 Equivalent |
| Sessions | Sessions (same concept, slightly different calculation) |
| Bounce Rate | Engagement Rate (inverted — higher is better in GA4) |
| Goals | Conversions (set up via Events in GA4) |
| All Traffic → Organic | Traffic Acquisition → Organic Search |
| Behaviour → Site Content | Engagement → Pages and Screens |
| Audience → Overview | Reports → User → User Attributes |
The most important GA4 setup step for SEO tracking is configuring your conversions. Without this, you can see traffic but not whether that traffic is doing anything useful for your business.
- For service businesses: Create a conversion event for contact form submissions, phone link clicks, and booking completions.
- For e-commerce: Enable enhanced e-commerce tracking via your platform (Shopify, WooCommerce) to capture purchase data.
- For content sites: Set up scroll depth and email sign-up events as proxy conversions.
How to Track Keyword Rankings
Your keyword rankings tell you whether your pages are moving up, staying flat, or losing ground to competitors. But rankings alone can be misleading — a page ranking fifth with a 6% CTR is more valuable than one ranking second with a 1% CTR.
In Google Search Console, go to Performance → Search Results. Set your date range to compare the current 90 days against the previous 90 days. Sort by Impressions to see your most visible queries, then cross-reference with Average Position and CTR to identify which pages need attention.
Identifying Quick-Win Ranking Opportunities
According to the Backlinko analysis of Google ranking factors, pages ranking in positions 5–15 are often the easiest to move. They already have some authority — they just need a targeted improvement to break into the top five.
Filter your GSC Performance report to show queries where your Average Position is between 5 and 15. These are your quick-win pages. The typical fixes are: improving the content depth, updating internal links pointing to that page, or refreshing the title tag to better match search intent.
Using a Rank Tracker for Deeper Monitoring
For small businesses managing 20 or more target keywords, a dedicated rank tracker saves time. Ahrefs Rank Tracker, SEMrush Position Tracking, and Moz Pro Campaigns all offer paid tracking with email alerts when rankings change significantly. For very small budgets, Google Search Console’s built-in performance data covers the essentials.
How to Track Organic Traffic in Google Analytics 4
In GA4, navigate to Reports → Acquisition → Traffic Acquisition. In the Session default channel group column, find Organic Search. This shows you the volume of sessions arriving from unpaid search results.
Track this number over rolling 90-day windows, not week by week. Weekly organic traffic fluctuates naturally due to seasonality, Google algorithm updates, and crawl cycles. A 90-day trend is a much more reliable signal of genuine progress.
Segmenting Organic Traffic by Landing Page
One of the most useful reports in GA4 for SEO is the Pages and Screens report filtered to organic traffic. This shows you exactly which pages are pulling in search visitors and which are invisible.
- Go to Reports → Engagement → Pages and Screens
- Click Add comparison and filter for Session medium / organic
- Sort by Views to see your top organic landing pages
- Cross-reference with GSC to see which queries are landing on each page
Pages with high organic traffic but low engagement time or high exit rates need a content quality review. Visitors are finding you through search but not finding what they need — a common sign of keyword-to-content mismatch.
How to Track Conversions from Organic Search
Traffic means nothing if it does not lead to business outcomes. Connecting your organic search traffic to revenue or leads is the most important — and most underused — part of SEO tracking for small businesses.
Setting Up Conversion Tracking in GA4
In GA4, go to Admin → Events. Any event can be marked as a conversion. The key is to set up events for the actions that represent real business value: form submissions, phone link clicks, appointment bookings, and purchases.
For a step-by-step guide to GA4 event tracking, the Google Analytics Help Centre provides official documentation for every event type. For contact form submissions specifically, most WordPress SEO setups can fire a GA4 event via Google Tag Manager without touching any code.
Reporting on Organic Conversion Rate
Once conversions are configured, go to Reports → Acquisition → Traffic Acquisition, then add Conversions and Conversion Rate as secondary metrics. This shows you exactly how many conversions your organic traffic is generating — and whether that rate is improving over time.
A healthy organic conversion rate varies significantly by industry. For a local service business, 2–5% is a reasonable baseline. For e-commerce, 1–3% is more typical. If your organic conversion rate is below 1%, investigate your landing page quality and the match between your content and search intent.
How to Track Core Web Vitals and Technical SEO Health
Core Web Vitals (CWV) are Google’s official set of user experience metrics that directly influence rankings. According to the Google Core Web Vitals documentation, the three key signals are Largest Contentful Paint (LCP) (loading speed), Interaction to Next Paint (INP) (responsiveness), and Cumulative Layout Shift (CLS) (visual stability).
| Core Web Vital | What It Measures | Good Score | Needs Improvement | Poor |
| LCP (Largest Contentful Paint) | Time until largest page element loads | ≤ 2.5 seconds | 2.5–4.0 seconds | > 4.0 seconds |
| INP (Interaction to Next Paint) | Responsiveness to user inputs | ≤ 200ms | 200–500ms | > 500ms |
| CLS (Cumulative Layout Shift) | Visual stability — elements jumping around | ≤ 0.1 | 0.1–0.25 | > 0.25 |
Check your Core Web Vitals in Google Search Console → Core Web Vitals for field data based on real users, and PageSpeed Insights for lab data on specific pages. If your CWV scores are in the ‘Needs Improvement’ or ‘Poor’ band, prioritise fixing them — they directly affect your rankings and your users’ experience.
Monitoring Index Coverage
In Google Search Console, go to Indexing → Pages to see which of your pages Google has indexed and which it has excluded. Common exclusion reasons include noindex tags, duplicate content signals, and crawl errors. If important pages are excluded, that is why they are not ranking.
Tracking Backlinks and Domain Authority
Backlinks remain one of the strongest ranking signals. Tracking your backlink profile tells you whether your site is growing in authority — and whether you have picked up any toxic or spammy links that could harm your rankings. The Ahrefs Blog’s research on backlinks and rankings consistently finds a strong correlation between quality referring domains and top-three rankings.
Google Search Console shows a basic backlink report under Links → External Links. For deeper analysis — including competitor backlink gaps and toxic link detection — Ahrefs Site Explorer, SEMrush Backlink Analytics, and Moz Link Explorer provide more granular data.
Focus on the trend of referring domains, not just total backlinks. Ten links from ten different authoritative sites are far more valuable than 100 links from one site. A healthy link profile shows consistent month-on-month growth in unique referring domains.
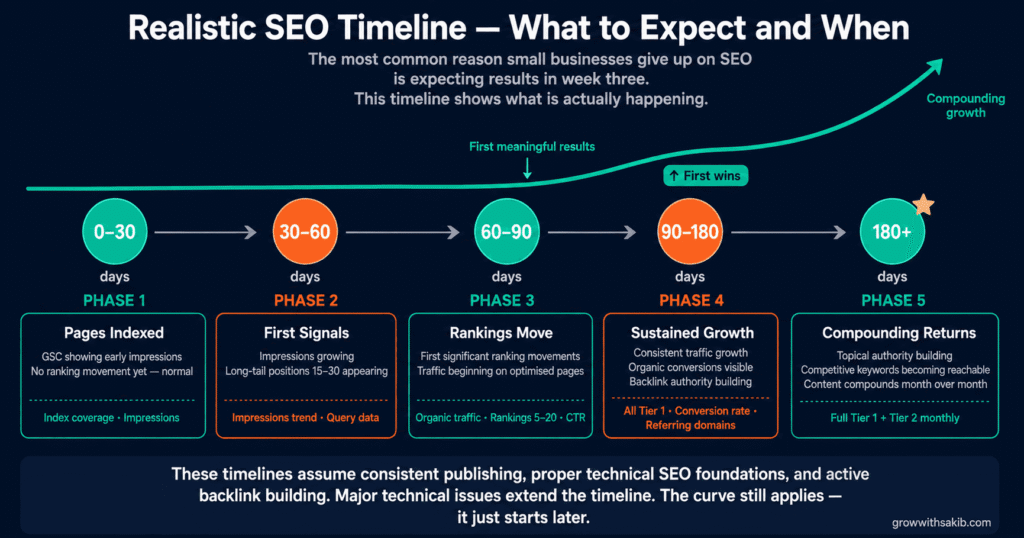
Realistic SEO Timeline: What to Expect and When
One of the most common reasons small business owners give up on SEO is misaligned expectations. They put in three weeks of work, see no change in rankings, and conclude it is not working. But SEO has a specific feedback curve — and knowing it in advance prevents premature abandonment.
| Timeframe | What You Should See | What to Track |
| 0–30 days | Pages indexed; GSC starting to show impressions (even if low); no significant ranking movement yet | Index coverage, initial impressions in GSC |
| 30–60 days | Impressions growing; some long-tail keyword appearances in positions 15–30; GSC showing which queries trigger your pages | Impressions trend, initial query data in GSC |
| 60–90 days | First significant ranking movements; traffic beginning on well-optimised pages; CTR data becoming useful | Organic traffic (GA4), rankings 5–20, CTR |
| 90–180 days | Sustained traffic growth; conversions from organic search visible; backlink growth beginning to show authority lift | All Tier 1 metrics, conversion rate, referring domains |
| 180+ days | Compounding growth; topical authority building; competitive keywords becoming reachable | Full Tier 1 + Tier 2 metrics monthly |
These timelines assume a consistent publishing schedule, proper technical SEO foundations, and active backlink building. If your site has major technical issues — slow page speed, thin content, poor mobile experience — the timeline will be longer.
Building a Simple Monthly SEO Report
You do not need a 20-slide deck to track your SEO effectively. A simple monthly report that takes 30 minutes to produce is far more valuable than an elaborate report you never look at.
The One-Page Monthly SEO Snapshot
- Organic traffic (this month vs. last month vs. same month last year) — this three-way comparison removes seasonality bias
- Top 5 ranking keywords — average position and any significant movements
- Impressions vs. clicks (CTR) — identify any CTR drops that suggest title/meta issues
- Organic conversions — total and rate; compare month over month
- New backlinks / referring domains — from GSC or your rank tracker
- Technical issues flagged — any new CWV failures, index exclusions, or crawl errors
- One insight + one action — what you learned and what you will change next month
For deeper SEO strategy guidance — including how to structure your content clusters for maximum tracking efficiency — the topical authority guide on GrowWithSakib explains how a hub-and-spoke model makes your reporting far cleaner.
Common SEO Tracking Mistakes (and How to Avoid Them)
| Mistake | Why It Causes Problems | What to Do Instead |
| Checking rankings daily | Normal fluctuations create false panic; wastes time and emotional energy | Review rankings weekly at minimum; use 90-day trend data for decisions |
| Tracking branded keywords only | Branded traffic grows with PR and word of mouth, not SEO — misleads you about organic performance | Separate branded vs. non-branded in GSC using the query filter |
| Ignoring impressions | Traffic without impressions context hides whether you have a rankings problem or a CTR problem | Always look at impressions and CTR alongside traffic numbers |
| Not setting up conversions | Traffic metrics look good while revenue stagnates; you can’t prove SEO ROI | Set up at least one conversion event in GA4 within your first week |
| Comparing different date ranges for seasonality | Year-over-year spikes look like SEO wins when they’re just seasonal patterns | Use year-over-year comparisons for traffic; MoM for trend direction |
| Attributing all organic growth to SEO | Brand campaigns, PR mentions, and viral content all drive organic traffic — not just SEO. | Segment organic search by query type; track direct and referral separately |
What SEO Tracking Cannot Tell You
Good SEO tracking tells you a lot. But honest practitioners acknowledge its limitations. These are the things your metrics will not reveal on their own:
- Why Google made an algorithm change — you can see the effect in your traffic data but rarely the cause. Follow Google’s official Search Central Blog for confirmed algorithm updates.
- The full revenue contribution of SEO — last-click attribution in GA4 undervalues SEO because many organic visitors convert on a later visit via a different channel. Consider data-driven attribution models in GA4 for a more accurate picture.
- Exactly what a competitor is doing — You can see their ranking changes but not their strategy. Third-party tools like Ahrefs provide estimates, not certainties.
- Future algorithm changes — no tracking data predicts what Google will change next. Build for quality, not for algorithm patterns.
Once you have your tracking system in place, the next logical step is understanding how to improve the numbers you are seeing. For on-page improvements, the on-page SEO guide on GrowWithSakib covers everything from title tags to structured data. For building the backlinks that move your authority metrics, see the link building strategy guide. And if your Core Web Vitals are holding you back, the technical SEO fundamentals article covers the fixes in detail.
Key Takeaways
- Use the Tiered Metrics Framework: check Tier 1 metrics (traffic, rankings, CTR, conversions, CWV) weekly; Tier 2 monthly; Tier 3 only when diagnosing a specific problem.
- Set up Google Search Console and Google Analytics 4 before anything else — both are free and cover all essential tracking for a small business.
- Always track organic conversions, not just traffic. Organic traffic without conversion data makes it impossible to prove or improve SEO ROI.
- Use 90-day trend windows, not weekly snapshots. SEO performance is a trend, not a daily scorecard.
- Pages ranking in positions 5–15 with low CTR are your fastest wins: fix the title tag and meta description before investing in new content.
- Core Web Vitals directly influence rankings — check your LCP, INP, and CLS scores in Search Console and PageSpeed Insights at least monthly.
- Separate branded vs. non-branded keyword traffic to get an accurate picture of your organic SEO performance.
- Build a one-page monthly SEO snapshot: seven data points, one insight, one action. Consistency beats complexity every time.
Frequently Asked Questions
1. How long does it take to see SEO results?
Most websites see early signs of SEO progress — growing impressions and initial ranking movements — within 30 to 60 days of publishing optimised content. Meaningful organic traffic usually follows within 90 to 180 days, depending on your domain’s existing authority, competition level, and content quality. Established sites in low-competition niches can move faster; newer sites in competitive industries take longer.
2. What is the most important SEO metric to track?
Organic conversions are the most important metric because they connect SEO directly to business outcomes. However, conversions require traffic to occur — so organic traffic and keyword rankings act as leading indicators. For most small businesses, start by tracking organic traffic trend, top keyword positions, and organic conversion rate as a trio. They tell you whether SEO is working and whether it is generating real value.
3. Is Google Search Console free to use?
Yes. Google Search Console is completely free for any website owner. It provides ranking data, impression data, CTR, index coverage, Core Web Vitals, backlink data, and mobile usability reports at no cost. It is the single most important free tool for SEO tracking and should be the first thing you set up before anything else.
4. How do I know if a drop in organic traffic is a problem?
Compare the drop against the same period last year to remove seasonal patterns. Then check Google Search Central for any confirmed algorithm updates around the same date. Check your Core Web Vitals and index coverage for new technical issues. A sudden sharp drop that aligns with a confirmed algorithm update or a new technical error is a real problem. A 10–15% week-on-week variation with no other signals is usually normal fluctuation.
5. Do I need a paid SEO tool to track results?
No. Google Search Console and Google Analytics 4 are both free and cover all Tier 1 metrics. Paid tools like Ahrefs, SEMrush, or Moz add value for competitive keyword research, deeper backlink analysis, and automated rank tracking — but they are not essential for a small business getting started with SEO tracking.
6. What is a good click-through rate for SEO?
Click-through rate varies significantly by position and query type. According to Backlinko’s analysis of click-through rates, the first organic result averages around 27.6% CTR, the second result around 15.8%, and the tenth result around 2.5%. For a small business with pages in positions 5–10, a CTR of 2–5% is reasonable. Below 2% in those positions suggests your title tag and meta description need improvement.
7. How do I track local SEO results?
For local SEO, add Google Business Profile Insights to your tracking alongside GSC and GA4. GBP shows how many people found your listing in Maps vs. Search, how many clicked for directions, and how many called directly. For full optimisation guidance, see the Google Business Profile guide. For local keyword rankings, filter GSC by location or use a rank tracker set to your target city. Local citations and review count growth are also important local SEO indicators.
8. How often should I review my SEO metrics?
For Tier 1 metrics, a weekly review is sufficient for most small businesses. Avoid checking daily — natural fluctuations create noise that leads to poor decisions. Run a full monthly SEO review covering all three metric tiers. Do a quarterly deep-dive that includes competitor analysis, content gap identification, and technical audit. Annual reviews should reassess your full keyword strategy and content architecture.