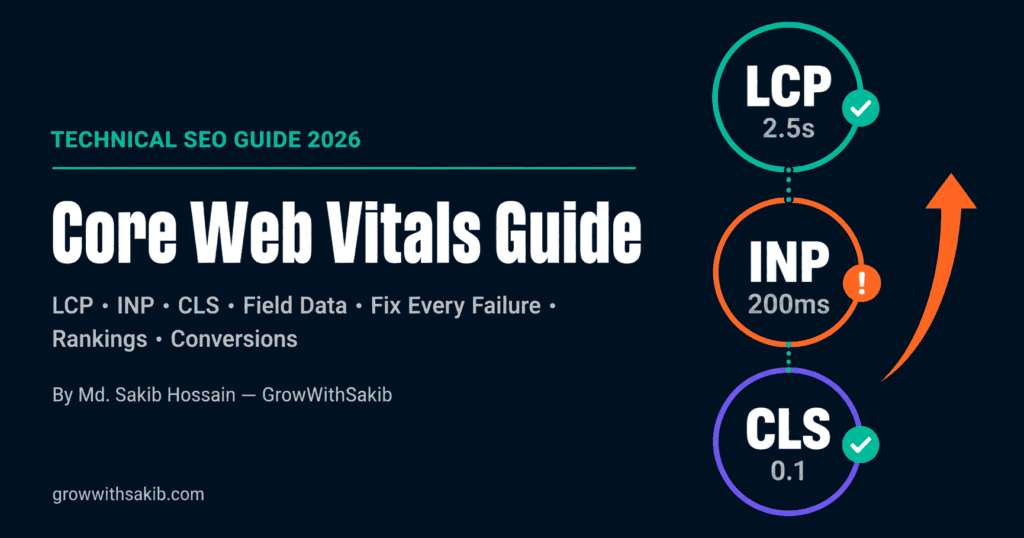
Most conversations about Core Web Vitals start with SEO — with ranking signals and algorithm updates. That framing is accurate but incomplete, and it causes a predictable mistake: site owners fix their Core Web Vitals scores just enough to pass Google’s thresholds, then stop.
The more important reason to take Core Web Vitals seriously is the business case. A 0.1-second improvement in page load time increases conversion rates by 8.4% for retail sites and 10.1% for travel sites, according to Google’s own research. A one-second delay reduces conversions by 7%. A site that frustrates users with layout shifts loses them at a rate that no amount of marketing budget can recover. Core Web Vitals are Google’s formalisation of measurements that affect revenue — not just rankings.
This guide covers everything you need: what each of the three Core Web Vitals measures, Google’s exact thresholds, the critical difference between field data and lab data that most guides confuse, the specific technical causes of every failure type, and the fixes that produce real improvements rather than just better tool scores — all within the broader technical SEO strategies that determine whether Google can crawl, index, and rank your site at all.
What Are Core Web Vitals and Why Do They Affect Rankings?
Core Web Vitals are three specific metrics that Google uses to measure real user experience on web pages — loading performance, interactivity, and visual stability. They were officially incorporated as ranking signals in Google’s Page Experience update in 2021 and have become an increasingly weighted factor as Google’s algorithm has matured.
Critically, Google evaluates Core Web Vitals using real-world data from actual users — not laboratory simulations. The data comes from the Chrome User Experience Report (CrUX), which aggregates performance data from Chrome browser users across the real-world conditions they experience: varying network speeds, different device capabilities, different geographic locations, and different times of day. This matters because a site can pass every lab test and still fail in the real world.
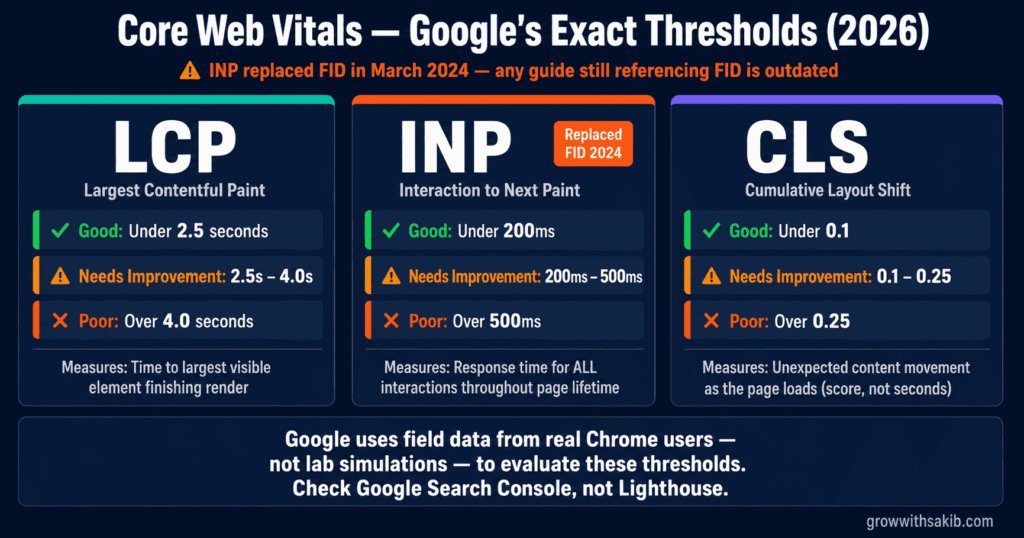
The three Core Web Vitals — thresholds and what they measure
| Metric | Good | Needs improvement | Poor |
|---|---|---|---|
| LCP (Largest Contentful Paint) | Under 2.5s | 2.5s – 4.0s | Over 4.0s |
| INP (Interaction to Next Paint) | Under 200ms | 200ms – 500ms | Over 500ms |
| CLS (Cumulative Layout Shift) | Under 0.1 | 0.1 – 0.25 | Over 0.25 |
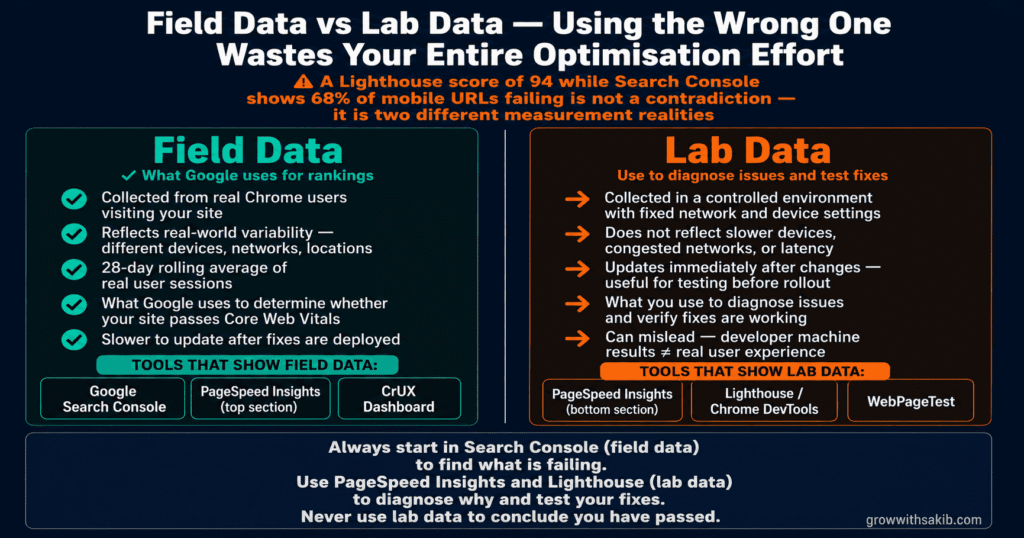
Field data vs lab data — the distinction that most guides mishandle
Understanding the difference between field data and lab data is not a technical detail — it determines whether your optimisation efforts actually improve your rankings or just improve your tool scores.
| Field data (what Google uses for rankings) | Lab data (what tools simulate) |
|---|---|
| Collected from real users visiting your site via Chrome | Collected in a controlled environment with fixed network and device settings |
| Reflects real-world variability — different devices, networks, locations | Does not reflect slower devices, congested networks, or geographic latency |
| Found in: Google Search Console, PageSpeed Insights (top section), CrUX dashboard | Found in: PageSpeed Insights (bottom section), Lighthouse, WebPageTest |
| Slower to update — 28-day rolling average of real user sessions | Updates immediately after changes — useful for testing fixes before rollout |
| What Google uses to determine whether your site passes Core Web Vitals | What you use to diagnose issues and test whether fixes are working |
LCP (Largest Contentful Paint) — Fixing Loading Performance
LCP measures the time from when a user navigates to a page to when the largest visible element has finished rendering. That element is typically a hero image, a large text block, a video thumbnail, or a background image — whatever occupies the most pixels in the initial viewport.
Google’s Good threshold is under 2.5 seconds. Performance between 2.5 and 4.0 seconds needs improvement. Above 4.0 seconds is Poor. In practice, most sites that fail LCP do so because of unoptimised images — it is the single most common cause, appearing in over 70% of LCP failures across the sites I have audited.
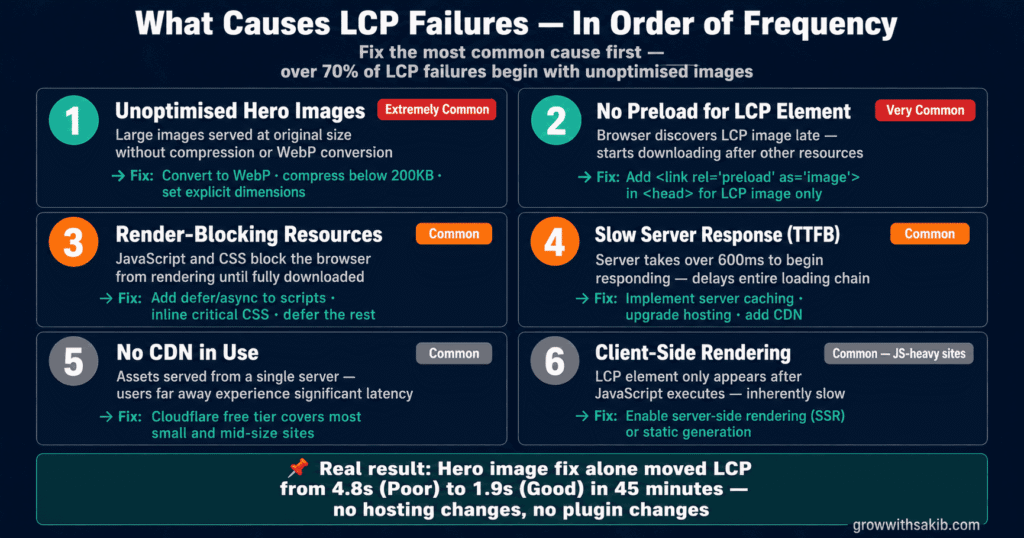
What causes LCP failures — in order of frequency
| LCP cause | Why it happens | How common |
|---|---|---|
| Unoptimised hero images | Large images served at original size without compression or modern format conversion | Extremely common — the leading cause of LCP failure on most sites |
| No preload for LCP element | Browser discovers LCP image late in the loading sequence — starts downloading it after other resources | Very common — affects most sites not using preload hints |
| Render-blocking resources | JavaScript and CSS that block the browser from rendering the page until fully downloaded | Common — especially on WordPress sites with multiple plugins |
| Slow server response time (TTFB) | Server takes over 600ms to begin responding — entire page load chain delayed before it starts | Common on shared hosting and unoptimised server configurations |
| No CDN in use | Static assets served from a single geographic server — users far away experience latency | Common on small and mid-size sites that have not implemented a CDN |
| Client-side rendering (CSR) heavy sites | JavaScript renders the page content — LCP element appears only after JS executes | Common on React, Vue, Next.js sites without SSR configuration |
How to fix LCP — step by step
Fix 1 — Optimise and convert your LCP image
- Identify your LCP element using PageSpeed Insights — it highlights the specific element in the report
- Download the image and check its file size. Any hero image above 200KB is a compression candidate
- Convert to WebP format — WebP is typically 25–34% smaller than JPEG at equivalent visual quality. Use Squoosh (free, browser-based), ShortPixel (WordPress plugin), or Sharp (Node.js for custom sites)
- Set explicit width and height attributes on the image element — this tells the browser how much space to reserve before the image loads, improving both LCP and CLS simultaneously
- Add a preload hint for your LCP image: Place <link rel=’preload’ as=’image’ href=’your-hero-image.webp’> in the <head> before any render-blocking CSS. This tells the browser to start downloading the LCP image immediately rather than discovering it later in the loading sequence
Fix 2 — Eliminate render-blocking resources
- In PageSpeed Insights, look for ‘Eliminate render-blocking resources’ under Opportunities
- For CSS: identify non-critical CSS and defer it. Load only the critical CSS needed for above-the-fold content inline; defer the rest
- For JavaScript: add defer or async attributes to non-critical scripts. Scripts with defer execute after HTML parsing completes without blocking rendering
- For WordPress: WP Rocket’s ‘Delay JavaScript Execution’ feature handles this automatically for most theme and plugin scripts
Fix 3 — Improve server response time (TTFB)
Time to First Byte (TTFB) above 600ms delays LCP before anything else on the page has a chance to improve it. TTFB is primarily a hosting and server configuration problem. Fixes in order of impact: implement server-side page caching (fastest win — reduces dynamic page generation to near-zero), upgrade to faster hosting (shared hosting frequently produces TTFB of 800ms–2s), and implement a CDN to reduce geographic latency for users distant from your server.
INP (Interaction to Next Paint) — Fixing Interactivity
INP measures the time between a user interacting with a page — clicking a button, tapping a link, pressing a key — and the browser completing the visual update in response. Unlike FID which it replaced, INP evaluates all interactions throughout the page’s lifetime, not just the first one. The worst interaction defines the score.
Google’s Good threshold is under 200ms. Between 200ms and 500ms needs improvement. Above 500ms is Poor. INP is the most technically complex Core Web Vital to diagnose and fix, because it depends on JavaScript execution patterns that vary between interactions, devices, and user behaviour sequences.
What causes INP failures
- Long tasks blocking the main thread: JavaScript tasks that run for more than 50ms block the browser’s main thread — preventing it from responding to user input. A user clicking a button during a long task waits for the task to complete before seeing any visual response.
- Inefficient event handlers: Click and keypress handlers that trigger complex calculations, DOM manipulation, or synchronous network requests create long response delays.
- Excessive third-party scripts: Analytics, chat widgets, advertising scripts, and social media embeds run JavaScript that competes with your core page functionality for main thread time. Each third-party script you add increases the risk of INP failures — especially on lower-spec mobile devices.
- Large JavaScript bundles: Pages that load large, unoptimised JavaScript bundles execute more code than necessary, creating more opportunities for long tasks to develop during page interaction.
How to diagnose INP issues
- Open Chrome DevTools → Performance panel
- Record a session while interacting with the page — click buttons, open menus, type in forms
- Look for red-flagged long tasks (tasks over 50ms) that coincide with your interactions
- Alternatively, use the Web Vitals Chrome extension — it shows real-time INP as you interact with a page
- In PageSpeed Insights, the ‘Avoid long main-thread tasks’ diagnostic identifies specific scripts responsible for blocking
How to fix INP
- Break up long tasks: Use setTimeout or scheduler.yield() to split JavaScript tasks that exceed 50ms into smaller chunks. This yields control to the browser between chunks, allowing it to process user interactions during pauses.
- Audit and remove unnecessary third-party scripts: For each third-party script on your site, ask: does this directly contribute to user experience or revenue? If the answer is unclear, remove it and measure the INP improvement. Marketing analytics and social widgets are frequently the heaviest contributors to INP failures.
- Use a CDN with edge caching: Faster page delivery reduces the JavaScript execution overhead that users experience as interaction latency — particularly for users on slower mobile connections.
- Defer non-critical JavaScript: Script that does not affect the initial page interaction should load after the page is interactive. Defer scripts handle DOM manipulation, tracking, and background functions that do not affect the user’s immediate experience.
CLS (Cumulative Layout Shift) — Fixing Visual Stability
CLS measures unexpected content movement that occurs as a page loads. Every time an element shifts position without the user triggering that movement — an image loading and pushing text down, an ad appearing and displacing the button the user was about to click, a font loading and reflowing the layout — it contributes to the CLS score.
Google’s Good threshold is under 0.1. Between 0.1 and 0.25 needs improvement. Above 0.25 is Poor. CLS is measured as a score (not a time value) — calculated from the impact fraction (how much of the viewport shifted) multiplied by the distance fraction (how far it shifted). The same layout shift on a large monitor produces a smaller CLS contribution than on a small mobile screen because the impact fraction relative to viewport size differs.
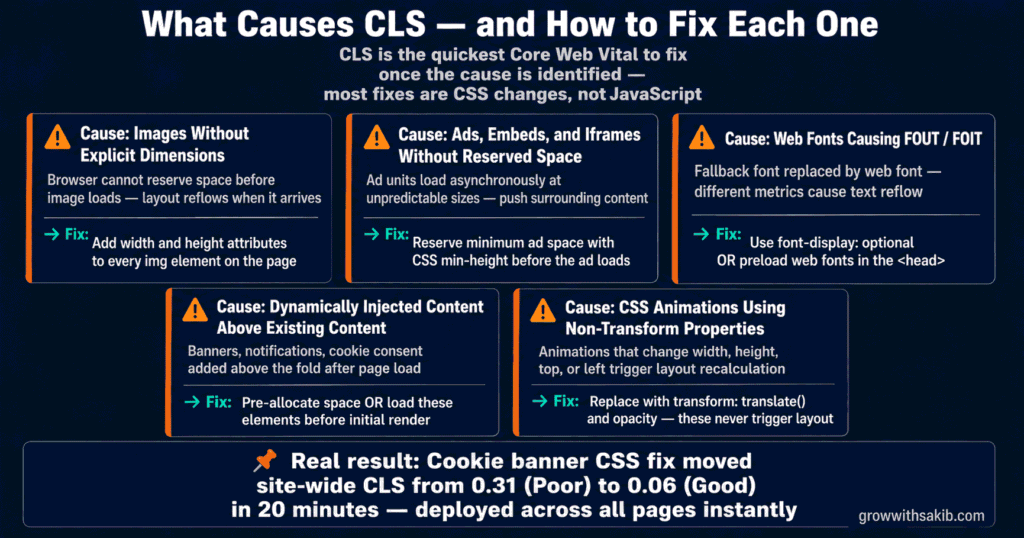
What causes CLS failures
| CLS cause | Why it happens | The fix |
|---|---|---|
| Images without explicit dimensions | Browser cannot reserve space before image loads — layout reflows when it arrives | Add width and height attributes to every img element |
| Ads, embeds, and iframes without reserved space | Ad units load asynchronously at unpredictable sizes — push surrounding content | Reserve minimum ad space with CSS min-height before the ad loads |
| Web fonts causing FOUT / FOIT | Fallback font replaced by web font — different metrics cause text reflow | Use font-display: optional or preload web fonts in the <head> |
| Dynamically injected content above existing content | Banners, notifications, cookie consent added above the fold after page load | Pre-allocate space or load these elements before initial render |
| CSS animations using non-transform properties | Animations that change width, height, top, or left trigger layout — use transform and opacity instead | Replace layout-triggering animations with transform: translate() |
How to diagnose CLS issues
- In PageSpeed Insights, the ‘Avoid large layout shifts’ diagnostic shows specific elements causing shifts
- In Chrome DevTools → Performance panel, Layout Shift events appear as red blocks on the Experience track
- Click any Layout Shift block in the Performance panel → Summary tab shows the specific node that shifted and its contribution score
- The Chrome Web Vitals extension highlights elements causing layout shifts in real time as you load the page — they appear with a blue border and shift indicator
The Right Tools for Measuring Core Web Vitals
Using the wrong tool for the wrong purpose is one of the most common reasons Core Web Vitals improvements feel invisible — you fix what a lab tool identifies but field data in Search Console does not improve. Understanding which tool to use for which purpose prevents this.
| Tool | Best use case | Free? | Paid? |
| Google Search Console | Monitor site-wide field data — which URLs are failing, aggregate scores across your entire site | Yes | No — free tool |
| PageSpeed Insights | Field data for specific URLs (when CrUX data is available) + lab diagnostics with specific fix recommendations | Yes | No — free tool |
| CrUX Dashboard (Looker Studio) | Historical field data trends over time — see whether your fixes are improving real user experience | Yes | No — free tool |
| Chrome Web Vitals Extension | Real-time metric display as you browse — shows LCP element, INP for each interaction, CLS events | Yes | No — free browser extension |
| WebPageTest | Advanced lab testing — filmstrip view, waterfall charts, device/network simulation | Yes (limited) | Yes — advanced features |
| Lighthouse (Chrome DevTools) | Deep lab diagnostics, opportunity identification, code-level fix suggestions | Yes | No — built into Chrome |
| SpeedCurve | Continuous performance monitoring — synthetic testing on a schedule, regression alerts | No | Yes — from $20/month |
The correct measurement workflow
- Start in Google Search Console → Experience → Core Web Vitals: This shows the field data picture — which URLs are failing, in which metric, on which device type. This is what Google uses for ranking. Fix the failing URLs in field data first.
- Use PageSpeed Insights for specific URL diagnosis: Enter failing URLs from Search Console. Read the field data section at the top first (if CrUX data is available for that URL) — this confirms the real-world score. Then read the Opportunities and Diagnostics sections for specific technical fixes.
- Use Chrome DevTools / Lighthouse to investigate specific issues: When PageSpeed Insights flags a problem but does not explain it fully, DevTools gives you the code-level detail. Performance panel for LCP and INP diagnosis, rendering panel for CLS investigation.
- Verify fixes with PageSpeed Insights lab data before deploying: Lab data updates immediately after changes. Use it to confirm your fixes are working before waiting for field data to update.
- Monitor field data improvement in Search Console over 4 weeks: Field data reflects a 28-day rolling average of real user sessions. Improvements from deployed fixes appear gradually over 3–6 weeks as the new data replaces old data in the rolling window.
Platform-Specific Core Web Vitals Fixes
WordPress — the highest-failure platform, with the most available fixes
WordPress powers approximately 43% of the web — and produces some of the most consistently poor Core Web Vitals scores, particularly on mobile. The causes are predictable: heavy themes with unoptimised assets, plugin bloat adding JavaScript and CSS, and default configurations that prioritise functionality over performance.
- Caching plugin (highest single impact): WP Rocket or LiteSpeed Cache reduce server response time by serving pre-generated pages instead of dynamically generating them on each request — the full setup is covered in the WordPress SEO setup guide.
- Image optimisation plugin: ShortPixel, Imagify, or Smush convert images to WebP, compress on upload, and serve appropriately sized images to each device. Set these to automatic — every uploaded image should be optimised without manual intervention.
- Switch to a lightweight theme: Premium page builder themes (Divi, Avada, BeTheme) frequently produce poor Core Web Vitals due to their volume of CSS and JavaScript. GeneratePress, Kadence, and Blocksy consistently produce better performance scores as starting points.
- Audit and remove unused plugins: Review every installed plugin. Inactive plugins still load code. Remove plugins that duplicate functionality, perform tasks you no longer need, or add scripts that contribute to INP failures — this is exactly the kind of upkeep covered in a technical SEO audit routine.
- Use a CDN: Cloudflare’s free tier provides CDN, caching, and image optimisation that consistently improves LCP for geographically distributed audiences. The setup takes approximately 30 minutes for most WordPress sites.
E-commerce sites — the CWV challenge at scale
E-commerce sites face unique Core Web Vitals challenges: product image galleries are natural LCP culprits, price and inventory updates can cause layout shifts, and the volume of third-party scripts (payment processors, review platforms, live chat, analytics) creates compounding INP pressure — alongside the Meta Pixel and Conversions API scripts most e-commerce sites also run for advertising.
- Lazy load below-fold product images: Set loading=’lazy’ on all product images that are not visible in the initial viewport. Only preload the LCP image (the first visible product image or hero).
- Reserve space for dynamically loaded price elements: On sites where prices or availability load after the initial HTML, pre-allocate the space with CSS min-height to prevent the layout shift when values populate.
- Audit third-party scripts ruthlessly: Every third-party script tag is an INP risk. Review monthly. Remove anything whose value cannot be clearly quantified.
How Core Web Vitals Actually Affect Rankings — The Honest Assessment
Core Web Vitals are a ranking signal — Google has confirmed this. But the nature and weight of that signal requires nuance that most guides either overstate or understate.
The ranking impact of Core Web Vitals is most visible in three scenarios:
- Highly competitive queries with many equivalent pages: When 20 pages all provide similar quality answers to a query, Core Web Vitals can be the differentiating factor. This is where improving from Poor to Good produces the most measurable ranking movement.
- Mobile-first indexing: Google uses the mobile version of your site for indexing and ranking. Pages that pass Core Web Vitals on desktop but fail on mobile are evaluated based on the failing mobile experience. This discrepancy affects a significant proportion of sites that developers primarily test on desktop.
- Local search results: Core Web Vitals have a more pronounced ranking influence in local search than in broad national queries, where Google has fewer pages to compare from equivalent geographic sources.
The conversion impact, however, is not conditional. A 0.1-second improvement in page load time increases conversions regardless of whether it moves your ranking. Page experience improvements produce business results independent of their ranking signal — which is why treating Core Web Vitals as purely an SEO task misses the larger opportunity, even though it remains one of the core diagnostics in any technical SEO audit.
Core Web Vitals Mistakes That Waste Optimisation Effort
| # / The mistake | What it costs | The fix |
|---|---|---|
| 01. Optimising desktop but ignoring mobile | Rankings use mobile score — desktop improvements have minimal ranking impact | Always measure and fix mobile first — use device emulation in PageSpeed Insights |
| 02. Treating lab data as the ranking signal | Lighthouse score of 94 while field data shows 68% of URLs failing — wrong data source | Check Google Search Console CWV report for field data — that is what Google uses |
| 03. Setting lastmod to today without content changes | Unrelated to CWV — but confuses users who expect fresh information | Focus on actual CWV causes: images, JavaScript, layout stability |
| 04. Compressing images but not converting to WebP | Smaller JPEG still larger than WebP at equivalent quality — missed 25–34% size reduction | Convert to WebP as standard — all modern browsers support it |
| 05. Fixing one metric while degrading another | LCP fix with lazy loading on hero image actually delays the LCP element | Never lazy load the LCP element — only apply lazy loading to below-fold images |
| 06. Adding preload for every image | Excessive preloading competes for bandwidth — delays LCP by congesting the network | Preload only the single LCP element — one preload hint maximum for images |
| 07. Only fixing pages with Poor scores, ignoring Needs Improvement | Competitive edge comes from moving from Needs Improvement to Good, not just avoiding Poor | Target all URLs in Needs Improvement for the competitive ranking advantage |
| 08. No monitoring after initial fix | Plugins, theme updates, and content changes reintroduce performance regressions | Monthly CWV check in Search Console — set up alerts for new failing URLs |
Core Web Vitals Audit Checklist
Diagnosis
| What to check | Why it matters |
|---|---|
| ☐ Google Search Console → Experience → Core Web Vitals reviewed — failing URLs identified by metric and device | Field data is what Google uses — start here, not with lab tools |
| ☐ Mobile and desktop scores checked separately — mobile treated as the primary priority | Google indexes mobile-first — mobile failures affect rankings regardless of desktop scores |
| PageSpeed Insights run on specific failing URLs — Opportunities and Diagnostics reviewed | URL-level diagnosis identifies the specific elements and scripts causing failures |
| ☐ LCP element identified in PageSpeed Insights — image, text block, or background image | Cannot fix LCP without knowing which element is being measured |
LCP fixes
| What to check | Why it matters |
|---|---|
| ☐ Hero/LCP image converted to WebP and compressed below 200KB | WebP at correct size is the single highest-impact LCP fix available on most sites |
| ☐ Preload hint added for LCP image in the <head> — one preload only | Preloading the LCP image advances its download in the browser’s priority queue |
| ☐ Width and height attributes set on LCP image element | Explicit dimensions prevent CLS and help browser allocate rendering space earlier |
| ☐ TTFB below 600ms — verified in PageSpeed Insights (server response time) | TTFB above 600ms delays the entire loading chain before any other fix can help |
| ☐ Render-blocking CSS and JS deferred or eliminated | Render-blocking resources delay LCP by preventing the browser from displaying content |
INP fixes
| What to check | Why it matters |
|---|---|
| ☐ Third-party scripts audited — unnecessary ones removed | Each third-party script competes for main thread time — the primary INP driver |
| ☐ Long tasks (over 50ms) identified in DevTools Performance panel | Long tasks block user interaction response — must be broken up or deferred |
| ☐ Non-critical JavaScript deferred with defer or async attributes | Deferred scripts do not block rendering or interaction during page load |
| ☐ WordPress plugin count reviewed — unused plugins removed | Plugin bloat is the leading cause of WordPress INP failures |
CLS fixes
| What to check | Why it matters |
|---|---|
| ☐ All images have explicit width and height attributes set | Missing dimensions cause layout shifts when images load — the most common CLS cause |
| ☐ Ad units and iframes have reserved minimum height in CSS | Ads without reserved space shift content when they load asynchronously |
| ☐ Web fonts loaded with font-display: optional or preloaded in <head> | Font swap without preload causes text reflow when web font replaces fallback |
| ☐ No dynamically injected banners or notifications above existing content | Above-fold injections cause large layout shifts visible to users and Google alike |
Frequently Asked Questions
Do Core Web Vitals directly affect my Google rankings?
Yes — they are a confirmed ranking signal. Google has stated they are part of the page experience signals used to rank search results. However, Google has also been clear that content relevance is far more important — a slow site with the best answer to a query typically outranks a fast site with a poor answer. The ranking impact of Core Web Vitals is most visible in competitive queries where multiple pages have comparable content quality. The business impact (conversions, bounce rate, user satisfaction) is significant regardless of ranking impact.
Why does my site score 90+ in Lighthouse but fail in Search Console?
Lighthouse measures lab data — a simulation run in controlled conditions with a specific device and network profile. Google Search Console shows field data — the actual experience of real users visiting your site on their own devices and network connections. Real-world users use slower devices, slower network connections, and encounter the page under varying conditions that Lighthouse cannot simulate. A 90 Lighthouse score reflects controlled laboratory conditions. Field data in Search Console reflects whether the median real user is having a Good experience. Always prioritise the Search Console data for assessing your true Core Web Vitals status.
How long does it take for Core Web Vitals fixes to show in Search Console?
Google Search Console displays a 28-day rolling average of field data. After you deploy fixes, the improvement appears gradually as new data points replace old ones in the rolling window. Most sites see measurable improvement in Search Console 3–6 weeks after deploying significant optimisations. The lab data in PageSpeed Insights updates immediately after changes — use it to verify your fixes are working before waiting for field data.
What is the biggest difference between FID and INP?
First Input Delay measured only the delay before the browser could begin processing the user’s very first interaction with the page. Interaction to Next Paint measures the complete time from any user interaction — clicking, tapping, or pressing a key — to the browser completing the visual update in response, across all interactions throughout the entire page session. INP is a more comprehensive and accurate measure of interactivity because it captures how the page responds during complex interactions and later in the session when more JavaScript has loaded and the page is more likely to have long tasks blocking the main thread.
Should I prioritise LCP, INP, or CLS?
Fix whichever metric is failing in your specific field data first. For most sites, LCP is the most common failure — particularly on mobile — and image optimisation produces the fastest improvement. CLS is often the quickest to fix once the cause is identified (usually missing image dimensions or dynamic content injection). INP is the most complex to diagnose and fix, requiring JavaScript profiling. Run Google Search Console to see which metric is failing for the most URLs, and start there rather than optimising in an arbitrary order.
Is Core Web Vitals optimisation a one-time task?
No — and treating it as one is the most common reason sites regress after initial improvements. Plugin updates, theme changes, new content with unoptimised images, new third-party scripts, and content management changes all introduce new performance issues over time. Build a monthly Core Web Vitals check into your technical SEO routine: review Search Console for new failing URLs, run PageSpeed Insights on your highest-traffic pages, and track whether your field data scores are improving or degrading. Maintaining a Good score is an ongoing practice, not a completed project.
The Bottom Line: Core Web Vitals Are a User Problem Before They Are an SEO Problem
The most useful mental shift when approaching Core Web Vitals is to stop thinking of them as a Google requirement and start thinking of them as a customer experience standard. A 4.8-second LCP is not failing Google’s threshold — it is making your visitors wait nearly five seconds to see the main content of your page. A CLS score of 0.31 is not a metric failure — it is your content jumping around on a mobile screen while someone tries to read it. A poor INP is not an algorithm signal — it is a button that feels broken because nothing happens when someone taps it.
Fix Core Web Vitals for your users. The rankings and conversions follow. Every site I have audited at GrowWithSakib that improved from Poor to Good on mobile Core Web Vitals saw measurable improvements in both organic visibility and conversion rates — not because Google rewarded them, but because their pages became genuinely better to use on the devices and connections their actual visitors were using.
Start with Google Search Console. Find your failing mobile URLs. Check the LCP element in PageSpeed Insights. Optimise that image. Add the preload hint. Set the dimensions. That sequence of actions — taking under two hours for most sites — will improve the experience of every user who visits your most important pages. Everything else is refinement from there.