Most Meta advertisers think they test. What they actually do is run multiple ads in the same ad set, watch which one gets more spend, and call that one the winner. This produces a conclusion, but not knowledge. It tells you which ad Meta’s algorithm preferred to allocate budget to early in the delivery cycle — which is not the same thing as which ad performs better with your audience.
Real A/B testing is controlled, isolated, and statistically grounded. When done correctly, it builds knowledge that compounds. When done incorrectly — which is the default for most accounts — it wastes budget and creates a false sense of data-driven decision-making.
This guide covers how to test correctly, what to test first, how to know when your results are actually real, and how to build the testing system that separates high-performing accounts from ones that are permanently guessing — within the complete Meta Ads framework.
Why Most Meta Ads ‘Testing’ Produces Unreliable Results
Before covering how to test correctly, it helps to understand the two most common ways testing goes wrong — because both are easy to do accidentally and neither produces a warning message in Ads Manager.
Problem 1: Audience overlap in manual tests
When you run multiple campaigns or ad sets targeting the same audience without using Meta’s A/B Testing tool, Meta does not split the audience evenly between them. As stated explicitly on Meta’s A/B Testing page, when multiple campaigns or ad sets run simultaneously without the Experiments tool, the system treats them in combination, skewing delivery and budget distribution. The same users can see both variants, and the comparison becomes meaningless.
This is the most common testing mistake. An advertiser duplicates a campaign, changes the creative in one, runs both simultaneously, and compares the results. The comparison feels analytical. But because the audiences overlap and the budget allocation is not controlled, the results are contaminated from the start.
Problem 2: Letting CBO pick a winner prematurely
The second common mistake is running an A/B test inside a Campaign Budget Optimisation (CBO) campaign. CBO’s purpose is to allocate more budget to the best-performing ad set. Within a testing context, this means the algorithm starts shifting budget toward the early front-runner — often within the first 24-48 hours — before either variant has received enough impressions to generate statistically reliable results.
As documented by Mako Metrics’s testing framework guide, stacking multiple ads in one ad set with CBO means Meta crowns the ad that received the most reach early, not the ad that genuinely performs better. This produces a confident-looking but unreliable outcome. Ad Set Budget Optimisation (ABO) — where you assign equal budgets to each ad set manually — is the correct structure for clean test conditions, and ensures your Meta Pixel is tracking conversions equally across both variants without delivery skew contaminating the attribution.
Experiments Tool vs Manual Testing: Which to Use and When
Meta offers two paths for A/B testing: the native Experiments tool and manual testing using separate ad sets with equal budgets. Each has the right use case.
| Factor | Meta Experiments Tool | Manual ABO Testing |
|---|---|---|
| Audience overlap | Automatically eliminated — non-overlapping groups guaranteed | Must be managed carefully; risk of contamination if same audience is used |
| Budget distribution | Even split enforced automatically | Requires equal manual budget allocation and discipline |
| Statistical significance | Calculated automatically, shown in results | Must use an external calculator or interpret manually |
| Variables you can test | Creative, audience, placement, delivery optimisation | Creative, audience, placement, copy, landing page — any variable |
| Best for | Clean, controlled tests of a single variable; getting reliable data quickly | Testing variables the Experiments tool does not support natively; ongoing creative iteration testing |
| Disadvantage | Less flexible; limited to supported variables; minimum campaign structure required | Requires discipline to avoid contamination; no automatic significance calculation |
| Recommended structure | Use for: audience tests, placement tests, delivery optimisation tests | Use for: creative iteration, copy tests, landing page tests |
For most creative tests, manual ABO is more flexible and sufficient when audience overlap is managed carefully — typically by using separate saved audiences with no overlapping interest layers. For audience tests and delivery optimisation tests, the Experiments tool produces cleaner results because it handles the splitting automatically.
How to set up a test in the Experiments tool
- Step 1: In Ads Manager, click the Experiments icon (or navigate to Measure & Report > Experiments). Select A/B Test.
- Step 2: Choose your variable — creative, audience, or placement. The tool will create two versions of the same campaign with your chosen variable changed.
- Step 3: Set your test duration (7-30 days recommended) and budget. The budget is split equally between the two variants.
- Step 4: Select your primary metric — the conversion event that determines the winner. Choose the metric closest to your business objective.
- Step 5: Review the Estimated Power display. If it shows below 80%, your budget or test duration is insufficient to detect a real difference. Increase budget, extend duration, or accept that the test is not viable at current scale.
- Step 6: Do not touch the test during the run. No budget changes, no pausing, no adding creatives. Monitor it, but do not intervene.
What to Test First: The Priority Hierarchy
Not all testing variables produce equal payoffs. Understanding the priority order lets you focus limited budget and time on the tests most likely to produce meaningful performance differences.
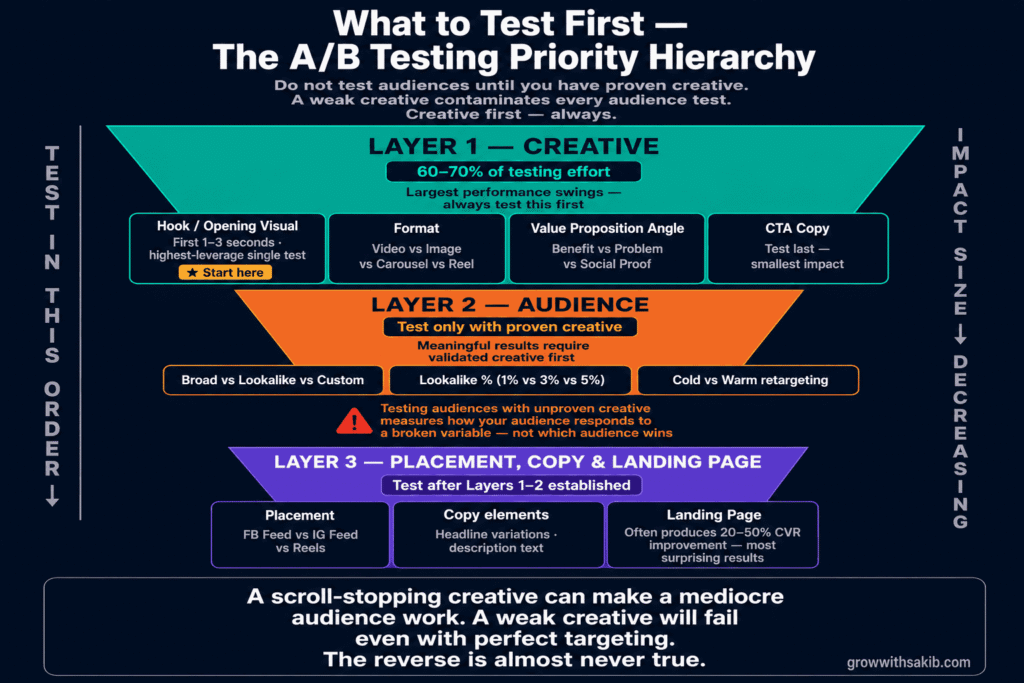
Layer 1: Creative — start here, always
Creative is where the largest performance swings live — and building a structured Meta Ads creative testing system at scale is what separates accounts that find winners consistently from those that find them by accident. As AdStellar’s campaign testing framework documents, sophisticated Meta advertisers dedicate 60-70% of their testing effort to creative variables because a scroll-stopping creative can make a mediocre audience work, while a weak creative will fail even with perfect targeting. The reverse is almost never true.
What this means practically: do not test audiences until you have proven creative. If you are testing Audience A vs Audience B with a creative that has not been validated, you are measuring how your audiences respond to an uncertain creative — not which audience performs better. The creative variable contaminates the audience test.
Within creative testing, test in this order:
- Hook / opening visual: the first 1-3 seconds of video or the primary image — the same element that determines Meta Pixel event quality when a viewer converts after watching through. This is what determines whether someone stops scrolling. A different hook on the same underlying message is the single highest-leverage creative test.
- Format: video vs static image vs carousel vs Reel — see the Meta ad formats guide for the full specs and placement behaviour of each format before designing your test. These produce genuinely different delivery patterns across placements and audience segments. Test the same message in different formats.
- Value proposition angle: benefit-focused vs problem-focused vs social proof-focused. Same product, different copy angle. This tells you how your audience frames the decision.
- CTA copy: ‘Shop Now’ vs ‘Learn More’ vs ‘Get Yours.’ Test this last — it produces smaller differences than the elements above, but matters for bottom-funnel campaigns.
Layer 2: Audience — test only with proven creative
Once you have creative that has demonstrated it can convert, audience testing becomes meaningful. As confirmed by Kettio’s Facebook A/B testing guide, testing broad audiences vs lookalikes vs interest-based audiences with the same proven creative tells you something reliable about which audience segment responds best. Testing audiences with unproven creative tells you very little.
Audience tests worth running in 2026 — given the shift toward algorithmic targeting — include: broad targeting vs lookalike audiences vs custom audience retargeting (using the same creative), and different lookalike percentages (1% vs 3% vs 5%) to understand the quality-reach tradeoff for your specific account.
Layer 3: Placement, copy elements, and landing page
Placement tests (Facebook Feed vs Instagram Feed vs Reels) and copy element tests (headline variations, description text) can produce meaningful differences but typically smaller than creative or audience changes. Test these after the higher-priority layers have been established.
Landing page tests often produce the most surprising results. As noted in the Ryze AI testing guide, landing page tests can produce 20-50% conversion rate improvements — but they require more technical setup to attribute correctly. When a test controls for ad creative and audience while varying the landing page, you get a clean measure of page performance that in-platform testing cannot provide.
Writing a Proper Testing Hypothesis
Testing without a written hypothesis before launch is how you end up with a history of ad launches rather than a body of knowledge. A hypothesis forces you to think through what you expect and why — and makes the result meaningful regardless of which variant wins.
The hypothesis structure
As documented by AdStellar’s testing strategy guide, a strong testing hypothesis follows a specific structure: If I change X, I expect Y because Z. The ‘because Z’ component is what most people omit — and it is the most valuable part.
What makes a testable hypothesis
- One variable: the hypothesis names exactly one element that changes. ‘New creative with a different audience’ is not a hypothesis — it is two changes that produce uninterpretable results.
- A specific prediction: not ‘I think this will be better’ but ‘I expect 15-25% lower CPA.’ The specific prediction forces you to decide in advance what constitutes a meaningful improvement.
- A reason: the mechanism that links the change to the expected result. If the reason is wrong, the test teaches you something about the mechanism.
- A success metric defined in advance: set your primary metric before launching. If you choose it after seeing results, you will unconsciously choose the metric that makes your preferred variant look best.
Statistical Significance: What It Means and Why It Matters
Statistical significance sounds like something you need a maths degree to understand. You do not. You need to understand two numbers — and what happens when you ignore them.
Confidence level (target: 95%)
Confidence level answers this question: ‘How likely is it that the difference I see between Variant A and Variant B is real rather than random?’
At 95% confidence, there is a 5% chance the difference is due to random variation. At 80% confidence, there is a 20% chance. At 70% confidence — which is where many tests end up when they are cut short — there is a 30% chance you are scaling the wrong ad.
Meta’s Experiments tool calculates this automatically and surfaces a winner notification with a confidence percentage. As Dataslayer’s A/B testing guide documents, only trust results at 95%+ confidence. Results between 85-95% are directional signals, not conclusions. Results below 85% should be treated as inconclusive regardless of which variant appears to be leading.
Statistical power (target: 80%)
Statistical power answers a different question: ‘If there is a real difference between my variants, how likely is my test to detect it?’
Low statistical power means your test might miss a genuinely better variant. You would run the test, see no significant difference, and incorrectly conclude the variants perform equally. As documented in the Meta Experiments setup guidance, Meta shows estimated power when you configure a test. If power is below 80%, your budget or test duration is insufficient. Increasing either — or accepting that the test is not viable at current scale — is the correct response.
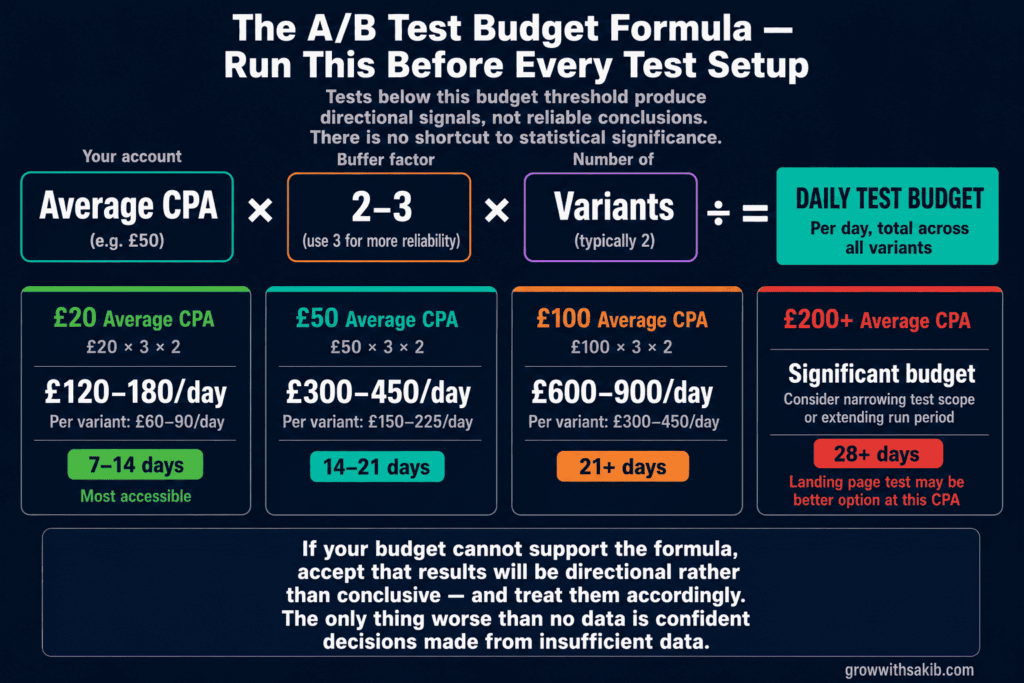
The budget formula for reliable tests
Budget is the lever that determines whether your test will achieve statistical significance. As Extuitive’s Meta A/B testing guide documents, the formula is: daily budget = 2-3x your average CPA, multiplied by the number of variants. This ensures each variant can generate enough conversions to produce statistically reliable results.
| Account CPA | 2 Variants | 3 Variants | Minimum Run Days |
|---|---|---|---|
| £20 average CPA | £120-180/day total (£60-90 per variant) | £180-270/day total | £7-14 days |
| £50 average CPA | £300-450/day total (£150-225 per variant) | £450-675/day total | 14-21 days |
| £100 average CPA | £600-900/day total (£300-450 per variant) | £900-1,350/day total | 21+ days |
| £200+ average CPA | Testing at this CPA requires significant budget — consider narrowing the test scope or extending the run period significantly | 28+ days |
How Long to Run a Meta Ads A/B Test
Test duration has a minimum but not a meaningful maximum. The minimum is set by the need to capture representative behaviour across at least one full week cycle.
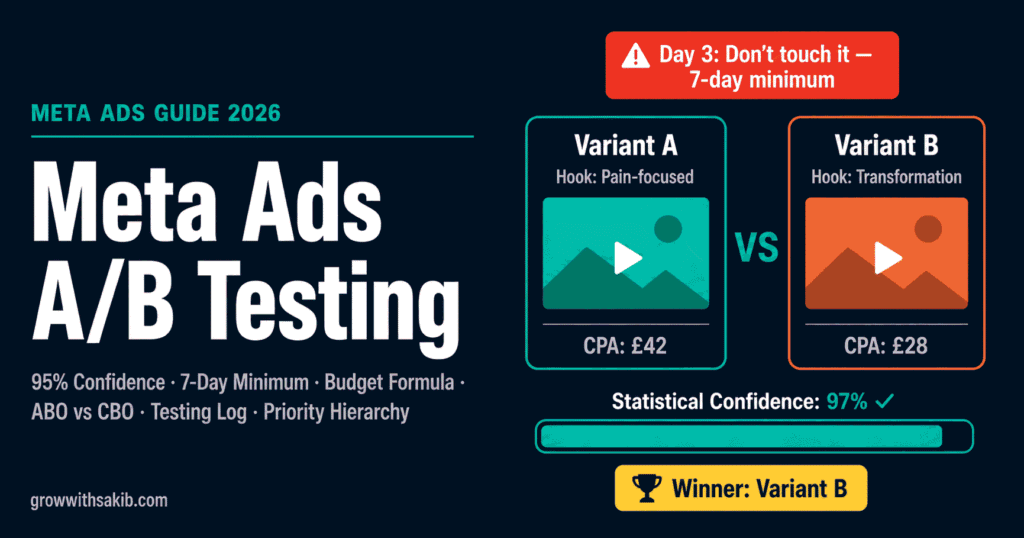
- 7 days minimum: always, regardless of how quickly you reach statistical significance. Consumer behaviour differs significantly between weekdays and weekends. A test that runs Monday to Thursday misses the weekend pattern entirely and produces a biased result. As Benly’s A/B testing guide documents, this seven-day floor applies regardless of how quickly significance appears.
- Creative tests: 7-14 days typically sufficient, given creative tests generally see higher click and impression volumes.
- Audience tests: 14-21 days, to account for audience warm-up periods and the variation in how different segments behave across the week.
- Placement tests: 14 days minimum to capture placement-specific delivery patterns across the full weekly cycle.
- Bid strategy or delivery optimisation tests: 21-28 days to allow the algorithm to stabilise its delivery model in both variants before comparing — the same stabilisation period required to exit the Meta ads learning phase.
When to stop a test early
The only valid reason to stop a test before reaching your planned end date is if one variant is performing so poorly that continuing it represents meaningful budget waste — specifically, if Variant B is spending at your planned rate but producing zero conversions after seven days when Variant A has produced several.
A strong early lead by one variant is not a valid reason to stop. Results can and do reverse between day three and day ten, particularly in tests with smaller sample sizes. The early leader is often the variant that happened to be shown to the most receptive users in the first few days of delivery — not necessarily the better performer.
Building a Testing System That Compounds Over Time
Individual tests produce insights. A systematic testing programme produces institutional knowledge. The difference between accounts that consistently improve and those that make the same mistakes repeatedly is almost always the presence or absence of a documented testing system.
The testing log: your most valuable account document
A testing log is a simple record of every test you have run — and should sit alongside the full campaign performance data in your Meta Ads Guide reference. After six months of consistent testing, this document tells you patterns that no single test could reveal: ‘Problem-focused hooks consistently outperform benefit-focused hooks with our audience’ or ‘Video beats static only on mobile placements.’ These patterns transform how you brief new creative and structure future campaigns.
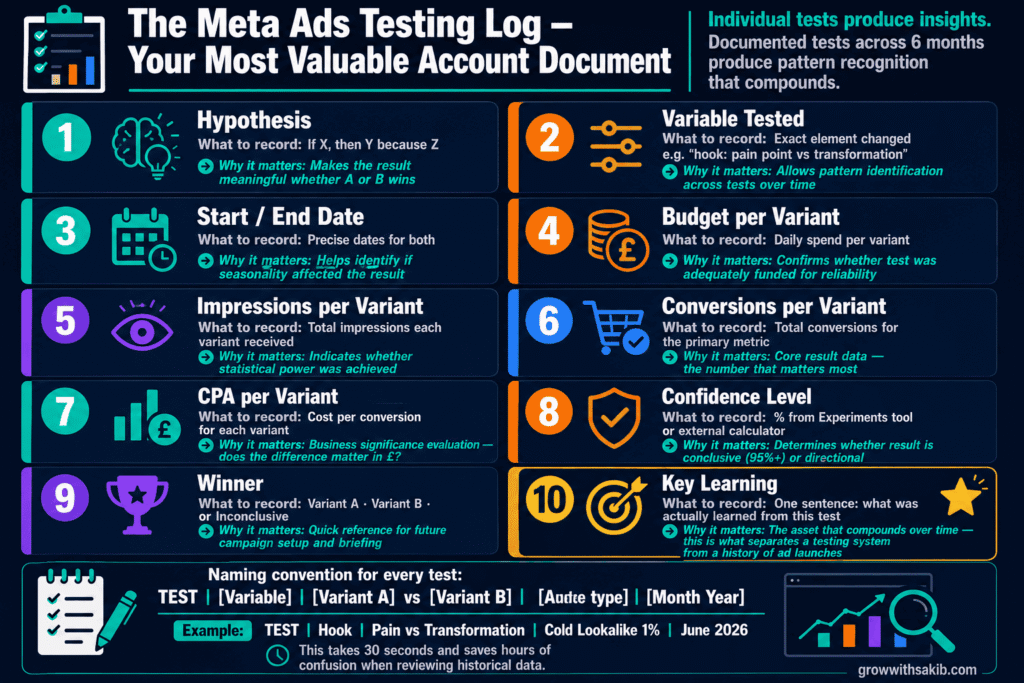
| Column | What to Record | Why It Matters |
|---|---|---|
| Hypothesis | If X, then Y because Z | Makes the result meaningful whether A or B wins |
| Variable tested | Exact element changed (e.g. ‘hook: pain point vs transformation’) | Allows pattern identification across tests |
| Start / end date | Precise dates | Helps identify if seasonality affected results |
| Budget per variant | Daily spend per variant | Confirms whether test was adequately funded |
| Impressions per variant | Total impressions each variant received | Indicates whether statistical power was achieved |
| Conversions per variant | Total conversions (primary metric) | Core result data |
| CPA per variant | Cost per conversion for each | Business significance evaluation |
| Confidence level | Percentage from Experiments tool or calculator | Determines whether result is conclusive or directional |
| Winner | Variant A, B, or Inconclusive | Quick reference for future campaign setup |
| Key learning | One sentence on what was learned | The asset that compounds over time, like the organic insights you capture when tracking SEO results monthly in Search Console. |
Naming conventions: set them up before you need them
As AdStellar’s testing strategy tutorial notes, a campaign named ‘Campaign 3 – Test’ tells you nothing six weeks later. A campaign named ‘TEST | Creative | UGC vs Static | Cold Audience | May 2026’ tells you everything at a glance — the variable, the audience segment, and the date. Consistent naming takes 30 seconds to set up and saves hours of confusion when reviewing historical data.
The recommended convention: TEST | [Variable] | [Variant A description] vs [Variant B description] | [Audience type] | [Month Year].
Kill criteria: when to pause a losing creative
Not every underperforming ad needs to run the full test duration. Kill criteria are pre-defined conditions under which you pause a variant early — not because it is losing, but because it is failing decisively enough to justify stopping.
- 48-72 hour kill: if a variant spends £50-100 and produces zero clicks (not just zero conversions), the creative is failing at the first hurdle and prolonging the test wastes budget. Pause and replace.
- 7-day kill: if a variant has received adequate impressions but converts at more than 2x the CPA of the other variant for seven days consecutively, it is statistically very unlikely to recover. The test is effectively decided.
- Never kill: a variant that is simply behind. ‘Behind’ is not the same as ‘failing.’ Markets fluctuate, delivery optimises differently, and the gap may close. Only decisive, sustained underperformance justifies early termination.
6 A/B Testing Mistakes That Produce Misleading Results
Mistake 1: Testing multiple variables simultaneously
If you change the creative, the headline, and the audience simultaneously in Variant B, you cannot determine which change drove the performance difference. This produces a confident-looking result that teaches you nothing actionable. The fix is strict variable isolation — one change per test, documented in advance.
Mistake 2: Declaring a winner before statistical significance
Variant B is winning after three days. You pause Variant A, scale Variant B, and later discover performance is no better — and sometimes worse — than the original. This is the most expensive testing mistake. Results can reverse completely between day three and day ten. The fix is holding the full test duration regardless of early results.
Mistake 3: Testing minor variations instead of meaningful differences
As Dataslayer’s testing guide notes, changing button colour from blue to slightly different blue will not move the needle. Testing significant differences — entirely different hooks, different value proposition angles, different formats, different audiences — produces meaningful results, and the Meta Ads retargeting strategy guide covers which variables produce the largest CPA differences for warm vs cold audiences specifically. Minor variations require enormous sample sizes to detect small differences, making them impractical for most accounts.
Mistake 4: Using CBO for tests instead of ABO
CBO shifts budget toward the early front-runner before you have sufficient data. This means the test is effectively decided by Meta’s algorithm before statistical significance is reached — and the algorithm’s early preference can be wrong. ABO gives each variant an equal budget for the full test duration. This produces more reliable results at the cost of slightly less efficient delivery.
Mistake 5: Not keeping a testing log
Without a log, each test starts from zero. You may test the same hypothesis twice without knowing it. You miss the pattern that ‘benefit-focused hooks always beat problem-focused hooks for our audience’ because you never had a view across more than one test at a time. The log is the mechanism that turns individual tests into compounding knowledge.
Mistake 6: Confusing statistical significance with business significance
A test can reach 95% statistical confidence with a 2% CPA improvement. That result is statistically real — but does a 2% CPA improvement justify the implementation effort, the campaign restructuring, and the disruption to a running campaign? Sometimes yes. Sometimes the better use of that knowledge is logging the learning and continuing to test more impactful variables. Statistical significance and business significance are different thresholds.
Frequently Asked Questions
What is the difference between Meta A/B testing and running multiple ads simultaneously?
Running multiple ads simultaneously in the same ad set is not A/B testing. Meta’s algorithm optimises delivery toward the best early performer, meaning one ad receives most of the impressions before statistical significance is reached. As Meta’s official A/B Testing documentation explains, true A/B testing using the Experiments tool divides your audience into random, non-overlapping groups with equal budget for the full test duration, producing statistically comparable results.
How long should a Meta Ads A/B test run?
Seven days minimum, regardless of how quickly you reach statistical significance. Consumer behaviour varies significantly between weekdays and weekends, and tests shorter than one full week produce biased results that miss this pattern. Creative tests typically complete within 7-14 days. Audience tests need 14-21 days. Bid strategy and delivery optimisation tests should run 21-28 days to allow the algorithm to stabilise. Never end a test early because one variant appears to be winning.
What budget do I need to run a reliable Meta Ads A/B test?
The formula: 2-3 times your average CPA, multiplied by the number of variants. For a 2-variant test with a £50 average CPA, plan for £300-450 per day total. This ensures each variant generates enough conversions for statistical significance within a reasonable timeframe. As documented in Extuitive’s A/B testing guide, tests with insufficient budget may surface a ‘winner’ but the result will not have the statistical power to be reliable.
What should I test first in Meta Ads?
Creative, always. As confirmed by AdStellar’s testing framework, sophisticated Meta advertisers allocate 60-70% of their testing effort to creative variables because creative produces the largest performance swings. A strong creative can compensate for a mediocre audience. Once you have proven creative, test audiences. Test placements and copy elements last. Landing page tests often produce the most surprising results despite being hardest to attribute.
What is statistical significance in Meta Ads testing?
Statistical significance measures the probability that the performance difference between your variants is real rather than random. At 95% confidence, there is only a 5% chance the difference you see is random variation. Meta’s Experiments tool calculates this automatically. Only declare a winner at 95% confidence or above. Results between 85-95% are directional — useful for hypothesis refinement but not reliable enough for major campaign decisions.
Should I use the Experiments tool or test manually?
Use the Experiments tool for audience tests and delivery optimisation tests — it handles the non-overlapping audience split automatically. Use manual ABO testing for creative and copy element tests where you need more flexibility than the Experiments tool provides. In either case, use Ad Set Budget Optimisation (ABO) rather than CBO to prevent the algorithm from shifting budget to an early leader before statistical significance is reached.
How do I know if my test results are trustworthy?
Check three things before declaring a winner: (1) confidence level — 95% or above in Meta’s Experiments tool or an external statistical significance calculator; (2) statistical power — Meta shows estimated power at test setup; if it was below 80%, the test lacked the sample size to detect a real difference even if one exists; (3) test duration — did it run for at least seven full days? If any of these three conditions are not met, treat the result as directional rather than conclusive.
Key Takeaways
- Real A/B testing requires non-overlapping audiences and equal budget distribution for the full test duration. Running multiple ads in the same ad set with CBO is not A/B testing.
- Test creative first — always. Creative drives the largest performance differences. Testing audiences with unproven creative produces misleading audience data.
- Write a hypothesis before every test using the structure: If I change X, I expect Y because Z. The ‘because Z’ component is what makes a losing result as valuable as a winning one.
- Never declare a winner below 95% confidence or before seven days have elapsed. Results regularly reverse between day three and day ten. Early confidence is often false confidence.
- Use the budget formula: 2-3x your average CPA per variant per day. Tests below this threshold produce directional signals, not reliable conclusions.
- Use ABO (Ad Set Budget Optimisation) for test campaigns, not CBO. CBO shifts spend toward the early leader before statistical significance is reached.
- Maintain a testing log. Individual tests produce insights. Documented tests across six months produce pattern recognition that compounds and transforms how you build campaigns.
- Statistical significance and business significance are different. A 2% CPA improvement at 95% confidence is real but may not justify major campaign restructuring. Evaluate both dimensions before acting.