The question every business owner asks before running their first Meta ad. And the answer every honest advertiser gives: it depends — but not in the frustrating, non-committal way that phrase usually lands.
There are real numbers. There are real benchmarks. And there are specific factors that determine whether you pay 30p per click or £3.00 for the same outcome. Understanding those factors is the difference between a business that finds Meta advertising profitable and one that burns through budget and concludes ‘it didn’t work.’
This guide gives you 2026 Meta ads cost benchmarks across every metric that matters — CPC, CPM, CPL, and CPA — broken down by industry, objective, and placement, and sits alongside the complete Meta Ads guide covering the full campaign framework. More importantly, it explains why your costs will be what they are, how the auction system that drives every penny of your spend actually works, and what you can do to move your costs in the right direction.
2026 Meta Ads Cost Benchmarks: The Numbers You Can Actually Use
Let’s start with the numbers — but with an important caveat. Every benchmark figure you see for Meta ads is a cross-industry average drawn from millions of campaigns with wildly different objectives, audiences, and creative quality. A single average CPC figure is like a single average salary figure: technically accurate and practically misleading without context.
Use these as orientation. Your actual costs will land somewhere on a range, and the factors in the next section explain where on that range you end up.
Platform-Wide Cost Benchmarks (2026)
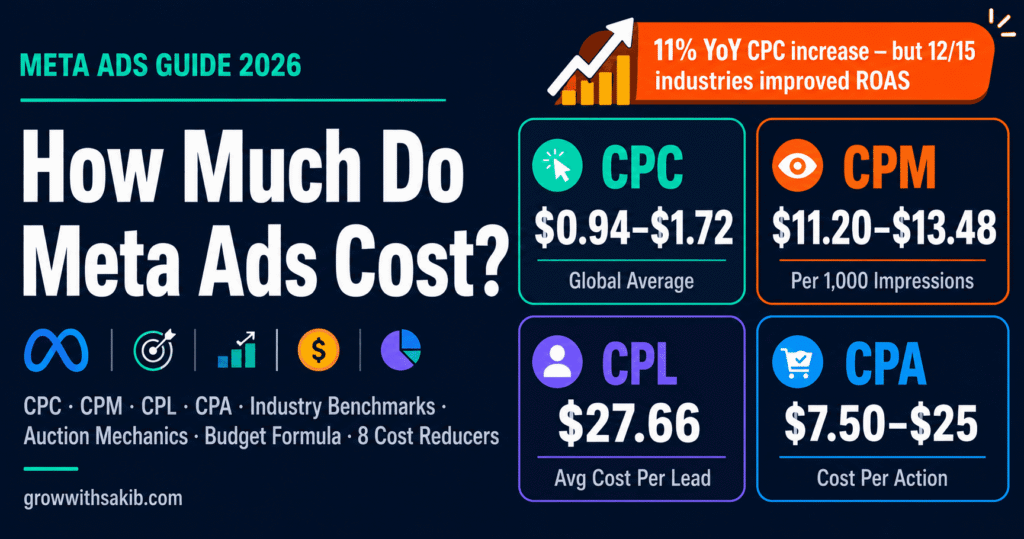
- Metric: CPC (Cost Per Click) – Global Average: $0.94 – $1.72 / US Average: $1.50 – $2.00 / What It Means: What you pay each time someone clicks your ad. Varies most by industry and objective.
- Metric: CPM (Cost Per 1,000 Impressions) – Global Average: $11.20 – $13.48 / US Average: $13.57 – $15.00 / What It Means: What you pay to show your ad 1,000 times. The foundational auction price for attention.
- Metric: CTR (Click-Through Rate) – Global Average: 0.90% – 2.19% / US Average: ~1.5% median / What It Means: % of people who saw your ad and clicked. Directly affects your effective CPC.
- Metric: CPL (Cost Per Lead) – Global Average: $27.66 overall / US Average: $30 – $80 (B2B) / What It Means: What you pay per form submission. Highly variable by industry and form friction.
- Metric: CPA (Cost Per Action) – Global Average: $7.50 – $25.00 (all objectives) / US Average: Varies widely / What It Means: What you pay per conversion. The metric that determines profitability.
- Metric: CVR (Conversion Rate) – Global Average: 1.57% – 7.72% / US Average: Varies by objective / What It Means: % of clicks that convert. Multiplied against CPC, this determines your CPA.
One data point worth holding: in 2026, Meta ads CPC rose approximately 11% year-over-year, driven by more advertisers entering the auction, AI-powered bidding, and increased Advantage+ adoption. But in the same period, twelve out of fifteen industry verticals posted year-over-year ROAS improvements — meaning higher costs delivered better returns for advertisers who optimised correctly.
The auction is more competitive. The algorithm is also better. Those two things happen simultaneously — and understanding Meta ad formats is one of the fastest ways to improve your creative quality score and lower your effective CPM.
Facebook vs Instagram: Where Does Your Money Go Further?
Meta’s platform spans both Facebook and Instagram, but the two surfaces have meaningfully different cost profiles. This comparison is something most cost guides skip entirely.
- Metric: Average CPC – Facebook: $0.94 / Instagram: $1.17 – $1.50 / When Each Wins: Facebook wins on CPC — better for traffic campaigns where volume matters
- Metric: Average CPM – Facebook: $11.20 – $13.00 / Instagram: $12.00 – $16.00+ / When Each Wins: Facebook generally cheaper; Instagram premium reflects higher engagement density
- Metric: CTR – Facebook: Moderate / Instagram: Higher (visual-first environment) / When Each Wins: Instagram typically generates more visual engagement; Facebook generates more clicks to external sites
- Metric: Conversion Rate – Facebook: Solid for feed / Instagram: Strong for product discovery / When Each Wins: Similar CPA when targeting is equivalent; Instagram edges for fashion, beauty, lifestyle
- Metric: Audience age skew – Facebook: 35+ skews older / Instagram: 18–34 skews younger / When Each Wins: Match to your customer demographics — not to where you assume your audience ‘is’
- Metric: Best use – Facebook: Direct response, lead gen, B2B / Instagram: Brand building, DTC, visual products / When Each Wins: Many campaigns benefit from running both and using Advantage+ Placements to allocate automatically
Meta Ads vs Google Ads: The Cost Comparison Nobody Does Properly
The question businesses often ask before committing to Meta: should I be on Google instead? The answer is not either/or, but the cost comparison is worth understanding.
- Metric: Average CPC – Meta Ads (Facebook & Instagram): $0.94 – $1.72 / Google Search Ads: $2.00 – $5.26+ / The Practical Implication: Meta is significantly cheaper per click — but Google clicks carry purchase intent that Meta clicks don’t
- Metric: Average CPL – Meta Ads (Facebook & Instagram): $27.66 / Google Search Ads: $70.11+ / The Practical Implication: Meta generates leads at roughly 2–3x lower cost — but typically requires more nurturing
- Metric: Audience targeting – Meta Ads (Facebook & Instagram): Interest, behaviour, demographic / Google Search Ads: Search intent (keyword-based) / The Practical Implication: Meta finds people based on who they are; Google finds people actively searching
- Metric: Demand capture vs creation – Meta Ads (Facebook & Instagram): Creates demand / Google Search Ads: Captures existing demand / The Practical Implication: Meta builds awareness for products people aren’t searching for yet; Google harvests intent that already exists
- Metric: Best for – Meta Ads (Facebook & Instagram): Awareness, discovery, e-commerce, lead gen at scale / Google Search Ads: High-intent conversion, local services, B2B SaaS with defined search terms / The Practical Implication: Most businesses with sufficient budget benefit from both — Meta fills the funnel; Google harvests intent
The short version: Meta costs less per click and per lead than Google in almost every industry — and both channels combined with SEO for small business create a full-stack acquisition system that reduces dependence on any single channel. But Meta’s lower costs reflect a lower-intent audience. Someone who sees your ad in a Facebook feed was not searching for your product. Someone who clicked your Google ad was. Factor that difference into how you evaluate CPA across platforms.
Meta Ads Cost by Industry: Where Your Category Sits
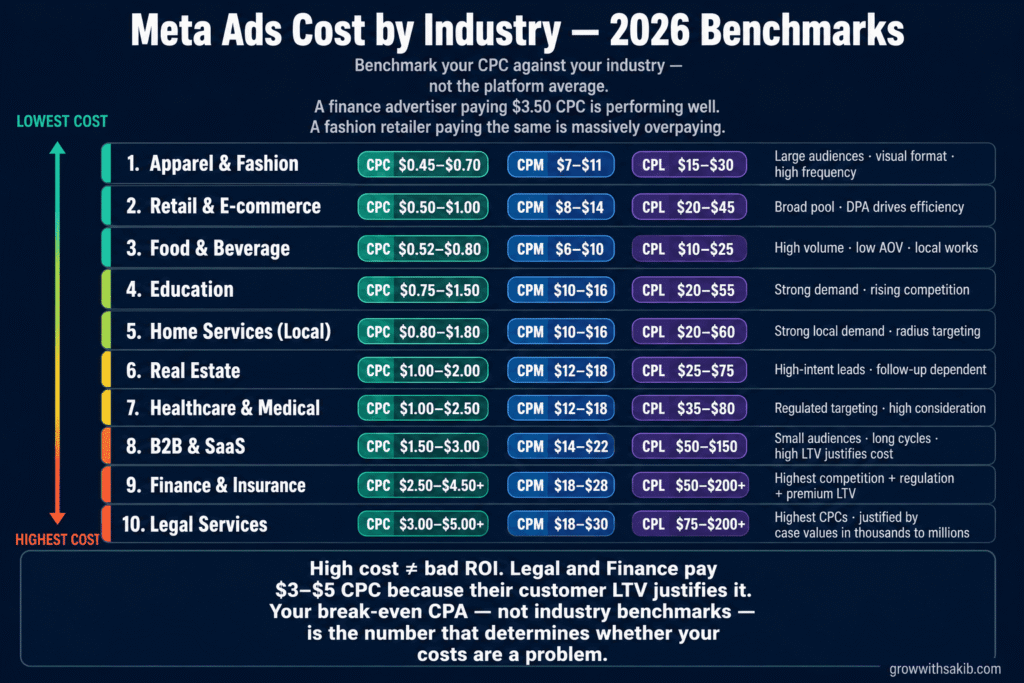
Industry is the single biggest variable in Meta ads pricing. A legal services firm and a fashion retailer are both on Meta, but they are operating in entirely different auction environments with different audience sizes, different competition levels, and different customer lifetime values.
- Industry: Apparel & Fashion – Avg CPC: $0.45 – $0.70 / Avg CPM: $7 – $11 / Avg CPL: $15 – $30 / Avg CPA: $15 – $35 / Why Costs Are Where They Are: Large audiences, visual-friendly format, high purchase frequency — competitive but high-volume
- Industry: Retail & E-commerce – Avg CPC: $0.50 – $1.00 / Avg CPM: $8 – $14 / Avg CPL: $20 – $45 / Avg CPA: $10 – $45 / Why Costs Are Where They Are: Broad audience pool; DPA and Advantage+ drive efficiency for established catalogs
- Industry: Food & Beverage – Avg CPC: $0.52 – $0.80 / Avg CPM: $6 – $10 / Avg CPL: $10 – $25 / Avg CPA: $10 – $30 / Why Costs Are Where They Are: High-volume, low-AOV; works best for local awareness and offers with low friction
- Industry: Education – Avg CPC: $0.75 – $1.5 / Avg CPM: $10 – $16 / Avg CPL: $20 – $55 / Avg CPA: $8 – $30 / Why Costs Are Where They Are: Strong demand; competition rising as online learning scales. Low CPA vs high LTV is the play.
- Industry: Healthcare & Medical – Avg CPC: $1 – $2.5 / Avg CPM: $12 – $18 / Avg CPL: $35 – $80 / Avg CPA: $30 – $100+ / Why Costs Are Where They Are: High-consideration decisions; regulated categories limit targeting depth
- Industry: B2B & SaaS – Avg CPC: $1.5 – $3 / Avg CPM: $14 – $22 / Avg CPL: $50 – $150 / Avg CPA: $50 – $200+ / Why Costs Are Where They Are: Small addressable audiences, long sales cycles, high LTV justifies premium spend
- Industry: Real Estate – Avg CPC: $1 – $2 / Avg CPM: $12 – $18 / Avg CPL: $25 – $75 / Avg CPA: $30 – $90 / Why Costs Are Where They Are: High-intent leads worth the CPL; conversion depends heavily on follow-up
- Industry: Finance & Insurance – Avg CPC: $2.5 – $4.5+ / Avg CPM: $18 – $28 / Avg CPL: $50 – $200+ / Avg CPA: $50 – $200+ / Why Costs Are Where They Are: Highest-cost vertical; intense competition + regulatory complexity + premium LTV
- Industry: Legal Services – Avg CPC: $3 – $5+ / Avg CPM: $18 – $30 / Avg CPL: $75 – $200+ / Avg CPA: $75 – $250+ / Why Costs Are Where They Are: Highest CPCs on the platform; justified by case values in the thousands to millions
- Industry: Home Services (Local) – Avg CPC: $0.80 – $1.80 / Avg CPM: $10 – $16 / Avg CPL: $20 – $60 / Avg CPA: $20 – $65 / Why Costs Are Where They Are: see the Meta Ads for local business guide for the full local targeting framework.
Why Meta Ads Cost What They Do: The Auction You Are Always In
Every impression on Meta is the result of an instantaneous auction. Every time a user scrolls past a point where an ad could appear, Meta runs a real-time competition among all advertisers eligible to reach that specific person. Understanding how that auction works is not optional background knowledge — it is the reason your costs are what they are.
The Total Value Formula
Meta does not sell impressions to the highest bidder. It awards them to the advertiser with the highest Total Value score:
Total Value = Bid × Estimated Action Rate × Ad Quality
This formula has a profound practical implication: you can lower your cost per result without changing your bid — by improving either your estimated action rate (how likely your specific audience is to take the desired action) or your ad quality (how positively people respond to your creative).
An advertiser with better creative and more relevant targeting regularly beats a competitor bidding twice as much. This is not a marginal effect. We have seen accounts at GrowWithSakib reduce their CPM by 30–40% purely through creative improvements, with no change in budget or targeting.
| Auction Variable | What Determines It | What You Can Control |
| Bid | Your bidding strategy (Lowest Cost, Cost Cap, Bid Cap, Minimum ROAS, Value Optimisation) | Bidding strategy selection and cap level — but overbidding wastes money; underbidding loses impressions |
| Estimated Action Rate (EAR) | Meta’s prediction of how likely this specific user is to take your desired action — based on audience history, past campaign data, Pixel signal quality | Audience quality, tracking setup (Pixel + CAPI), creative relevance to the audience, offer-market fit |
| Ad Quality | Meta’s assessment of your creative based on user engagement signals: CTR, video completion rate, positive vs negative feedback (saves, likes vs hides, reports) | Your creative — hook strength, visual quality, copy relevance, CTA clarity — this is your highest-leverage cost lever |
The Creative Quality Multiplier — the Cost Lever Most Advertisers Ignore
Of the three auction variables, Ad Quality is the one most advertisers treat as fixed when it is actually their most powerful lever. Here is the mechanism:
When your ad performs well — high CTR, strong video completion, lots of saves and positive engagement, very few hides or reports — Meta updates its Estimated Action Rate upward for future auctions. A higher EAR means Meta can win the same impressions at a lower effective cost. Your actual cost per result drops without you changing a single targeting setting or bid.
The reverse is equally true. Low CTR, high report rates, and frequent ‘hide this ad’ responses are negative signals that raise your effective cost. Bad creative does not just fail to convert — it makes your entire campaign more expensive.
The 7 Factors That Determine Your Actual Meta Ads Cost
These are not generic ‘factors that affect cost’ — they are the specific levers you can diagnose and move.
1. Campaign Objective
Your campaign objective tells Meta what action to optimise toward. It directly affects which users Meta targets (and at what cost), because different actions have different conversion rates across the audience.
| Objective | Typical CPM Range | Why |
| Awareness / Reach | Lowest — $5 to $10 | Optimises for impressions, not actions. Targets the widest eligible audience. |
| Traffic | Low-Medium — $8 to $14 | Optimises for link clicks. Finds clickers, not converters. Generally poor for conversion goals. |
| Engagement | Low — $6 to $12 | Optimises for likes, comments, shares. Large audience pool keeps CPM down. |
| Leads | Medium — $12 to $20 | Optimises for form completions. Narrower qualifying audience = higher CPM. |
| Sales / Conversions | Highest — $15 to $30+ | Optimises for purchases or high-intent actions. Targets the highest-converting subset — most expensive but most valuable. |
2. Audience Targeting
Audience size and specificity have a direct relationship with CPM. Smaller, more specific audiences compete in a smaller auction pool — fewer advertisers are bidding, but the people you can reach within that pool become more expensive per impression because they are more sought-after.
- Broad targeting (Advantage+ Audience): Typically produces lower CPMs because Meta has a large pool to find efficient impressions within. The algorithm does the filtering work rather than the audience definition.
- Interest-based targeting: CPM rises as you narrow. A million-person interest audience costs more than a five-million-person broad audience because the smaller pool is more competed-for.
- Retargeting custom audiences: Typically highest CPM, but also highest conversion rate. Small pool + premium targeting = expensive impressions that often deliver the best CPA of any audience type.
- Lookalike audiences: Mid-range CPM. Quality depends entirely on the seed audience — a lookalike built from your top 1% customers outperforms one built from all site visitors.
In 2026, the trend among experienced Meta advertisers has shifted toward broader targeting — letting Meta’s machine learning find converters across a wider population rather than pre-defining narrow interest segments. This often produces lower CPMs and competitive CPAs, particularly for accounts with strong Pixel history.
3. Creative Quality
Covered in detail in the auction mechanics section above. The short version: better creative lowers your effective cost per result. Specifically, improving your CTR from 0.8% to 1.5% on the same budget produces roughly 87% more clicks at the same total spend — effectively halving your CPC without touching your bid.
The elements that most directly drive CTR and therefore lower CPCs:
- Hook quality — the first 1.5 seconds of video or the dominant visual of an image
- Copy specificity — speaking to one defined person’s specific situation outperforms broadcast messaging
- Offer clarity — the value of clicking should be obvious before the user decides whether to
- Social proof elements — testimonials, review counts, credibility signals that reduce friction
4. Placement
Different placements have different CPMs. Reels consistently delivers lower CPMs than Feed across most objectives in 2026. Right Column (desktop only) is the cheapest placement but also the least engaging. In-Stream video is low CPM but requires horizontal video creative that few advertisers maintain.
| Placement | CPM Range | Notes |
| Facebook Feed | $10 – $18 | High engagement context; competitive CPM |
| Instagram Feed | $11 – $20 | Visual-first; premium CPM reflects higher engagement density |
| Facebook Reels | $8 – $14 | Lowest CPM of major placements; requires vertical video |
| Instagram Reels | $8 – $15 | Growing inventory as Explore traffic migrated here in Jan 2026 |
| Stories (FB + IG) | $9 – $16 | Full-screen immersive; CPM varies by objective |
| Facebook Right Column | $5 – $9 | Desktop only; lowest CPM but also lowest engagement — image only |
| Audience Network | $4 – $9 | Lowest CPMs overall; lowest quality traffic — use selectively |
| Messenger | $8 – $13 | Moderate CPM; works well for direct message objectives |
| Threads | $6 – $11 | New placement (Jan 2026); lower CPM as inventory builds |
5. Audience Location
Geographic targeting has a significant impact on CPM. US, UK, Australian, and Canadian audiences are among the most expensive in the world because of high advertising competition and consumer purchasing power. Targeting the same product in a lower-competition market cuts CPMs substantially.
| Market | CPM Relative to US Baseline | Practical Notes |
| United States | 100% (baseline, most expensive) | Highest competition; essential for US brands but expensive for global campaigns |
| United Kingdom | 75 – 85% | Second tier; premium market but lower auction density than US |
| Canada / Australia | 70 – 80% | Similar to UK; English-language premium audiences |
| Western Europe | 50 – 70% | Variable by country; Germany and France command higher CPMs than Southern Europe |
| Latin America | 20 – 35% | Large audiences, low CPMs; conversion rates depend heavily on localised creative |
| Southeast Asia | 15 – 30% | Fastest-growing Meta market; dramatically lower CPMs, rapidly rising competition |
6. Seasonality
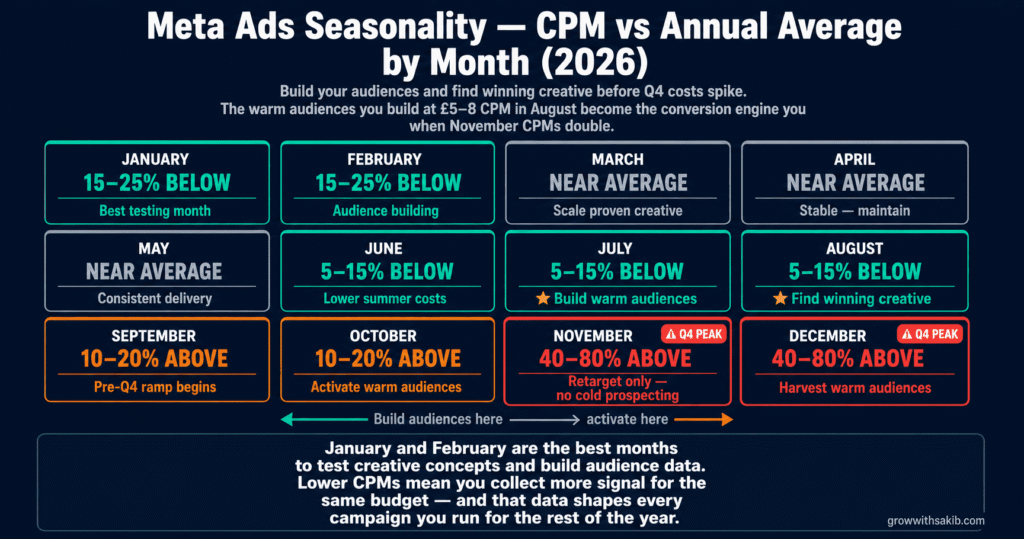
Q4 is the most expensive time to advertise on Meta. Black Friday through Christmas sees CPMs increase 40–80% above their baseline as every retail brand in the world competes for the same holiday-shopping audience. This is not a small fluctuation — it materially affects whether campaigns that run profitably all year remain profitable in Q4.
| Period | CPM vs Annual Average | Strategic Implication |
| January – February | 15 – 25% below average | Best cost efficiency of the year; ideal for testing and audience building |
| March – May | Near average | Stable costs; good for scaling campaigns with proven creative |
| June – August | 5 – 15% below average | Lower summer competition; travel and education verticals are exceptions |
| September – October | 10 – 20% above average | Pre-holiday ramp-up begins; start building audiences before costs spike |
| November – December | 40 – 80% above average | Highest-cost period; e-commerce needs pre-built audiences to compete profitably |
The practical implication: if you sell products that gift well, do not start your Meta advertising in October. Build your audiences and find your winning creative between July and September when CPMs are lower, then enter Q4 with warm audiences already in your retargeting pool and proven creative that you can scale at premium prices.
7. Ad Account History and Pixel Data Quality
New ad accounts without historical data cost more to optimise. Meta’s algorithm needs conversion history to understand who your buyers are. Without it, it is essentially guessing — and guessing costs more because the Estimated Action Rate is lower.
This is why the first campaign on a new account often feels expensive and then improves. It is also why accounts with rich Meta Pixel data — proper Conversions API setup, high Event Match Quality scores — consistently achieve lower CPAs than accounts with sparse or inaccurate tracking. The algorithm learns faster from clean data. Faster learning means reaching optimal delivery sooner — and spending less to get there.
How Much Should You Actually Spend? Budget Recommendations by Business Stage
The technical minimum daily budget on Meta is $1. The practical minimum that generates any useful signal is around $10–15/day. The budget that allows proper learning phase completion and sustainable optimisation is meaningfully higher. Here is how to think about it at different stages.
The Learning Phase Budget Formula
The most useful budget framework in Meta advertising is not a fixed number — it is a calculation based on what you are trying to optimise for:
Minimum weekly budget = 50 events × Target CPA
Daily minimum = (50 × Target CPA) ÷ 7
Meta needs approximately 50 optimisation events per ad set per week to exit the learning phase and deliver stable, optimised results. If your target cost per purchase is £30, you need £1,500 per week (approximately £215/day) to give one ad set enough budget to learn properly. If your target CPL is £15, you need £750/week.
This is why vague ‘start with $10/day’ advice fails. Ten pounds a day generating £30 conversions means you get one conversion every three days. At that rate, the ad set will still be in learning phase after three months.
| Business Stage | Monthly Budget Range | What This Covers | Realistic Expectations |
| Testing / proof of concept | $500 – $1,500 | One campaign, 2–3 creative variants, one audience. Enough to collect data, not enough to optimise. | Directional data only. You will learn what does not work faster than what does. This is valuable. |
| Initial optimisation | $1,500 – $3,000 | Enough for one ad set to exit the learning phase at a $30–$60 CPA target. Beginning of real optimisation. | Consistent delivery begins. Expect 4–6 weeks before reliable performance patterns emerge. |
| Active scaling | $3,000 – $8,000 | Multiple ad sets, multiple audiences, creative testing programme. Advantage+ Shopping viable for e-commerce. | This is where Meta starts compounding — better data → better targeting → lower CPA. |
| Established growth | $8,000 – $25,000+ | Full-funnel campaigns, DPA, retargeting stack, multiple creative programmes. Algorithm has rich data. | Predictable performance. CPA stability. ROAS above break-even with room to scale. |
The Budget Most Competitors Recommend Is Wrong for Most Businesses
Most Meta ads guides recommend starting with $10–$30/day and scaling from there. This works for e-commerce brands selling $20 products with simple purchase funnels. It rarely works for service businesses with $100+ CPL targets, B2B companies with multi-touch sales cycles, or any business where the average transaction value requires building trust before purchase.
If your average order value is $200, your target CPA might reasonably be $40–$60. To generate 50 conversion events in seven days at $50 CPA, you need $2,500/week — not $10/day. Starting smaller is fine for learning, but understand that you are in data collection mode, not optimisation mode, until you hit that threshold — the same patience applies to how long SEO takes to compound for small businesses investing in organic search.
How to Calculate Your Break-Even CPA (The Number That Makes Cost Benchmarks Meaningful)
Average CPC and CPM benchmarks tell you what everyone else pays. They do not tell you whether that cost is profitable for your business. The metric that does is your break-even CPA — the maximum you can pay per customer before the campaign costs you money.
Break-Even CPA Formula
Break-even CPA = Average Order Value × Gross Margin %
Example: If your average order value is £100 and your gross margin is 50%, your break-even CPA is £50. Every customer you acquire for less than £50 is profitable. Every customer acquired above £50 costs you money.
For subscription businesses or products with repeat purchase behaviour, replace ‘Average Order Value’ with Customer Lifetime Value (LTV). A customer who spends £100 once and £80 in three repeat purchases has an LTV of £260 — meaning a £100 CPA that looks unprofitable on first purchase is actually profitable when the full customer relationship is included.
Target CPA vs Break-Even CPA
Your target CPA should not be your break-even CPA. Break-even is the maximum you can spend. Your target should be the CPA at which the campaign is profitable enough to justify the investment risk and overhead.
A common framework: target a CPA that represents 60–70% of your break-even CPA — apply the same structured measurement discipline when tracking SEO results alongside your paid campaigns for a complete picture of acquisition cost. This leaves a margin buffer for CPA volatility (weeks above and below average), for fixed overhead that the CPA calculation doesn’t capture, and for the time cost of managing campaigns that are only just breaking even.
8 Proven Ways to Reduce Your Meta Ads Cost Without Hurting Results
These are not generic tips. Each one addresses a specific mechanism in the auction that, when improved, directly lowers your cost per result.
1. Fix your hook — it is the highest-leverage creative change you can make
CTR is your most direct cost lever. Improving CTR improves your Estimated Action Rate, which improves your Total Value score, which lowers the effective cost of winning impressions. The element that most determines CTR is your hook — the first 1.5 seconds of a video or the dominant visual of an image.
Test radically different hook concepts before testing copy variations, audience segments, or bid strategies. A hook that increases CTR from 0.8% to 1.6% halves your effective CPC without touching a single campaign setting.
2. Refresh creative before frequency becomes a problem
When your audience has seen the same ad more than 3–4 times on average (frequency), CTR starts dropping and CPM starts rising. The algorithm interprets declining engagement as a quality signal and charges you more to reach the same people. The fix is always creative — not budget increases.
Monitor frequency weekly. When it crosses 3, either refresh your creative or expand your audience. Do not wait until CPM has already risen significantly — the damage to your account history is harder to reverse than it is to prevent.
3. Broaden your audience and let creative do the filtering
Narrow audiences have higher CPMs because you are competing in a smaller auction pool. In 2026, many experienced Meta advertisers run broad targeting with minimal interest restrictions and let the creative filter the audience — relevant people engage, irrelevant people scroll, and Meta learns quickly who your actual buyers are.
This counterintuitive approach often produces lower CPMs and comparable CPAs to tightly-defined interest audiences. Test it against your current targeting before concluding it is not right for your business.
4. Match your campaign objective to your actual goal
Every mismatch between your objective and your goal wastes money. Traffic campaigns optimise for clicks — not purchases. Engagement campaigns optimise for likes — not leads. The algorithm is extraordinarily good at finding the outcome you ask for. Make sure you are asking for the right thing.
If you want leads, use the Leads objective with Lead Ad or Website conversion as your conversion location — the full objective framework is covered in the Meta Ads playbook. If you want purchases, use the Sales objective. Traffic campaigns should only be used when the goal is literally website traffic — not as a cheaper proxy for conversion campaigns.
5. Implement proper tracking to improve your Estimated Action Rate
Accounts with rich, accurate conversion data consistently outperform accounts with sparse or inaccurate tracking — see the complete CAPI setup guide for the full implementation process. Meta’s algorithm cannot optimise toward an outcome it cannot see. Every conversion event you fail to track is data the algorithm could have used to find similar users more cheaply.
Pixel + Conversions API + domain verification + high Event Match Quality scores give Meta the complete signal it needs to lower your effective CPA. This is not a marginal improvement — accounts that implement CAPI typically see 15–25% improvement in CPA within 4–6 weeks as the algorithm gains better data to work from.
6. Build audiences before expensive seasons
Q4 CPMs are 40–80% above baseline. Running cold-audience awareness campaigns in November is extremely expensive. The alternative is building warm audiences during lower-CPM periods (June–September) through organic content, video views, and lower-cost traffic campaigns — then converting those warm audiences in Q4 when retargeting costs less than prospecting at elevated CPMs.
The retargeting audiences you build for £5–£8 CPM in August become the conversion-ready audiences you activate in October, before Q4 costs peak.
7. Consolidate budget into fewer, larger ad sets
Meta’s algorithm performs better with concentrated budget than fragmented budget. An account running five ad sets at £20/day each generates weaker optimisation signals than two ad sets at £50/day. Each ad set needs to generate 50 conversions per week to exit the learning phase — fragmented budgets prevent this.
Consolidate. Fewer, better-funded ad sets with strong creative outperform many underfunded ad sets with the same total spend.
8. Pause low performers early — but not during the learning phase
The instinct to pause underperforming ads quickly is correct — but timing matters. Making changes during the learning phase (before 50 optimisation events) resets the learning phase and can make costs worse. Give ad sets the data they need to optimise before evaluating performance.
After the learning phase: pause ad sets with CPA more than 30% above your target consistently over 7+ days. Redirect that budget to ad sets performing at or below target CPA. Over time, this concentrates spend in your best performers and removes budget from your expensive outliers.
Frequently Asked Questions About Meta Ads Cost
What is the minimum budget for Meta ads?
Technically, Meta’s minimum daily budget is $1. Practically, a budget that allows any useful optimisation starts at around $10–$15/day. The minimum budget for a campaign to exit the learning phase and deliver reliable results is: 50 optimisation events × your target CPA ÷ 7 days. If you are targeting a £30 CPA, you need approximately £215/day minimum for one ad set to learn properly. Most small businesses need at least £1,500–£2,000/month to see meaningful results.
Are Meta ads cheaper than Google ads?
On most metrics, yes — significantly. Meta’s average CPC sits at $0.94–$1.72 vs Google Search’s $2–$5+. Meta’s average CPL is $27.66 vs Google’s $70+. However, the lower cost reflects a lower-intent audience. Meta ads reach people based on who they are; Google Search reaches people actively searching for what you sell. For many businesses, the most effective strategy combines both: Meta for building awareness and demand, Google for capturing intent that Meta generates.
Why are my Meta ads so expensive?
The most common causes: (1) Creative fatigue — your audience has seen your ads too many times, CTR is falling, and Meta is charging more for declining-quality impressions. Frequency above 3–4 is the clearest signal. (2) Wrong objective — running Traffic campaigns for conversion goals means you are finding clickers, not buyers. (3) Audience too narrow — competing in a small auction pool raises CPM. (4) Poor Pixel tracking — the algorithm cannot optimise on incomplete data, so it wastes spend on lower-converting users. (5) New account with no history — costs normalise as the algorithm accumulates data. Diagnose which of these applies before increasing budget.
What is a good ROAS for Meta ads?
A ‘good’ ROAS is any ROAS above your break-even ROAS — the point at which your ad spend covers the cost of the product or service you sold. Calculate yours: Break-even ROAS = 1 ÷ Gross Margin %. At 50% gross margin, break-even ROAS is 2x. At 30% gross margin, break-even ROAS is 3.3x. Most e-commerce businesses target 3–5x ROAS as a healthy range. But use MER (total revenue ÷ total ad spend across all channels) alongside ROAS for the most accurate profitability picture, particularly if you run multiple advertising channels simultaneously.
Do Meta ad costs increase during Q4?
Yes, significantly. Black Friday through Christmas is the most expensive advertising period of the year on Meta. CPMs increase 40–80% above baseline as retail brands massively increase budgets. For businesses selling gift-appropriate products, this means campaigns that run profitably all year may become marginal or unprofitable in Q4 unless planned for. The most effective approach: build warm audiences at lower CPMs between July and October, then activate those audiences in Q4 rather than prospecting cold audiences at peak prices.
How long before Meta ads become profitable?
Realistically: 4–8 weeks of active optimisation for most businesses. The first two weeks are typically learning phase — the algorithm is exploring, costs are often higher than steady-state, and results are inconsistent. Weeks three through six see costs stabilise and CPAs begin reflecting the account’s real potential. True optimisation — finding your best creative and audience combination — typically takes 2–3 months of consistent testing. Businesses that expect profitability in week one almost always conclude ‘Meta ads don’t work’ when they were actually in the middle of a normal learning curve.